New Era of Heavy Flavor Measurements at RHIC: PHENIX Silicon Vertex Tracker
March 19, 2012
By Rachid Nouicer
One of the striking discoveries from the heavy-ion program at the Relativistic Heavy Ion Collider (RHIC) is that the medium created in central 200 AGeV Au-Au collisions behaves like a nearly perfect fluid. This finding was rated the top physics news story of 2005 and the four experiments at RHIC: BRAHMS, PHENIX, PHOBOS, and STAR published White Papers discussing the evidence of the existence of this new form of matter [1].
To investigate the properties of this new state of matter, usually referred to as the Quark Gluon Plasma (QGP), penetrating and well calibrated probes are essential to quantitatively deduce the effect of the medium on those probes. One type of such probe are hadrons which carry a heavy flavor - a charm quark with mass mc ≅ 1.5 GeV or a beauty quark with mass mb ≅ 5 GeV - like D- and B-mesons. These mesons present a powerful tool to study the properties of the hot, dense medium created in high-energy nuclear collisions as they are generated early in the reaction and subsequently diffuse through the created matter.
At RHIC, the PHENIX experiment currently studies heavy-quark production indirectly via the measurement of electrons from semileptonic decays of hadrons carrying charm or beauty without distinguishing between D- and B-mesons. As shown in figure 1, taken from Ref. [2], there are two rather unexpected observations that have emerged. First, heavy mesons, despite their large mass, exhibit a suppression at high transverse momentum (pT) compared to that expected from p+p interactions, see panel (a). This suppression is found to be similar to that of light mesons which implies a substantial energy loss of fast heavy quarks while traversing the medium. Secondly, an elliptic flow is observed for heavy mesons which is comparable to that of light mesons like pions (π+, π−, π0), see panel (b). This flow implies a collective motion of heavy quarks in the expanding medium.
In order to understand these medium effects in more detail it is imperative to directly measure the nuclear modification and flow of D- and B-mesons independently. Based on this motivation and impelled by the exciting physics we have already uncovered, the PHENIX Collaboration opened a new era for measuring heavy flavor at RHIC by constructing a new detector called the Silicon Vertex Tracker (VTX). The detector construction was carried out by the PHENIX VTX collaboration from BNL, Columbia U, ISU, ORNL, LANL, RBRC, SBU, UMASS, UNM in the USA, JAEA, KEK, RIKEN, U Tokyo, Kyoto U, Rikkyo U in JAPAN and Ecole Polytechnique in FRANCE.
The VTX detector consists of four layers of barrel detectors located in the region of pseudorapidity |η| < 1.2 and covers almost 2π azimuthal angle. Pseudorapidity, η, is defined as η = −ln[tan(θ/2)], where θ is the detected particle emission angle relative to the beam axis; η=0 is at 90° to the beam direction and η=1 is close to 45°.
The two inner barrels of VTX detector consist of silicon pixel detectors (SPD). The technology of SPD is based on the ALICE1LHCb sensor-readout hybrid, which was developed at CERN for the ALICE and LHCb experiments. The first and second silicon pixel barrels consist of 10 and 20 ladders, respectively. One ladder is electrically divided into two independent half-ladders. Each ladder consists of four sensor modules mounted on a mechanical support called a stave. Each stave is made from a Carbon-Fiber Composite built at LBNL. Each sensor module consists of a silicon pixel sensor with a pixel size of 425 μm (z) × 50 μm (ϕ) bump-bonded with four pixel readout chips. The construction of the pixel ladders were achieved at RIKEN and external private companies for high precision tasks in Japan. The pixel readout electronics was developed by the VTX collaboration at SBU and Ecole Polytechnique. The total number of channels in the VTX pixel detector is around 4 Million [3].
The two outer barrels of the VTX are constructed using silicon stripixel sensors. Researchers at the Instrumentation Division at BNL have developed a novel stripixel silicon sensor, a single-sided, N-type, DC-coupled, two-dimensional sensitive detector [4,5]. This design simplifies fabrication for both the sensor and signal processing compared with that for the conventional double-sided strip sensor. Each pixel from the stripixel sensor consists of two implants interleaved such that both implants register the charge deposited by ionizing particles. Each interleaved implant is 5 μm wide and makes 5 turns in each pixel. The effective pixel size is 1000 μm (z) × 80 μm (ϕ). Each sensor has 1536 channels. The silicon sensors were mass-produced by the Hamamatsu Photonics (HPK) company in Japan. The overall size of the silicon sensor is about 34.9 ± 0.04 mm wide, 63.6 ± 0.04 mm long, and 0.625 ± 0.015 mm thick. The stripixel sensor is read out with the SVX4 chip developed by the FNAL/Berkeley collaboration. The SVX4 chip is designed and fabricated in the 0.25 μm CMOS process on 300 μm thick silicon. The third and fourth of the VTX barrels consist of 16 and 24 of silicon stripixel ladders, respectively. The total number of channels in the VTX stripixel detector is around 0.5 Million. The readout electronics of the stripixel detector was developed by the VTX collaboration at ORNL and Columbia U. The stripixel detector construction was done by the VTX collaboration and PHENIX technical support at BNL. The wire-bonding and encapsulation from SVX4 chips to silicon sensor were achieved at FNAL. Figure 2 shows the ladders of half barrels of pixel and stripixel as well one complete half of the assembled VTX detector.
The VTX detector construction phase is now complete and the detector was installed around the interaction point at the PHENIX experiment in December 2010. Figure 3(a) shows the side view of the VTX detector installed around beryllium beam pipe. This picture shows that the readout cables, cooling and nitrogen systems were connected to the detector. The inset in figure 3(a) shows the front view of the VTX detector when the detector two halves are closed. The commissioning was started by looking to the charge injection in the detector through the full readout chain. The VTX detector commissioning was completed by the end of the 500 GeV p+p run in Run-11 and the detector was fully integrated in the PHENIX DAQ system. Subsequently, the VTX detector took physics data during Run-11 with Au + Au collisions at energies 19.6, 200, and 27 GeV. Figure 3(b) shows the event display for a single Au + Au collision at 200 GeV from Run-11. The event display shows that the detector is working properly and the stand-alone tracking finds the tracks in the high multiplicity environment of Au + Au collisions at 200 GeV.
The first look in off-line data analysis from Run-11 obtained by VTX detector is shown in Figure 4. Panel (a) shows the energy deposition spectra in Au + Au at 200 GeV compared to p+p at 500 GeV for |η| < 0.5 for the VTX stripixel detector. These spectra from stripixel detector demonstrate that the principle of two-dimensional position sensitivity based on charge sharing works and the signal-to-noise value is about 11.
The key element needed in directly identifying D- and B-mesons in PHENIX is the ability to measure the collision vertex position with a high accuracy and to compare that with the trajectory for each track. D- and B-mesons decay into light mesons or leptons before reaching the detectors, thus the daughter particles are observed. As these do not originate at the collision vertex position, a large distance occurs between the vertex position and the daughter particle trajectory. Based on the VTX detector measurements of the primary vertex, the beam size, and individual tracks for each collision in Au + Au collisions at 200 GeV, the reconstructed distance of closest approach (DCA) distribution from the beam center has been determined.
Panel (b) shows the beam size of Au + Au collisions at 200 GeV obtained using the tracks from VTX detector. The measured σY of the beam size is 104.6 μm. This value is consistent with expected from a formula σlum = √{ϵβ*} / √{2 γπ} = 105 μm where the emittance ϵ = 10 μm, the beta value at the collision point β* = 0.75 m and the Lorentz factor γ = 107.4 for Au + Au at 200 GeV.
Panel (c) shows the DCA distribution from the beam center. The width, σY (DCA), of the distribution is about 137 μm. Since this includes the beam spot size of 104.6 μm mentioned above, we estimate that the DCA resolution of individual tracks to the beam center of order of 88 μm for pT > 1 GeV/c has been achieved and it is consistent with our Monte-Carlo Simulations.
The achieved DCA resolution is sufficient to distinguish D- and B-mesons from the difference of their decay-length. The decay-length (cτ) of D0 and D± are 123 and 312 μm, respectively, while those of B0 and B± are 457 and 491 μm, respectively. The presented measurements using the PHENIX VTX detector elucidate clearly that this detector is working as expected and heavy flavor physics by measuring D- and B-mesons independently is very promising [6].
In summary, the PHENIX silicon vertex tracker (VTX) project was completed within the budget and on schedule. The VTX detector commissioning was completed by the end of the 500 GeV p+p run of Run-11 and was fully integrated in the PHENIX DAQ system. Subsequently, the VTX detector took physics data with Au + Au collisions during Run-11 at energies 19.6, 200 and 27 GeV. Early measurements using PHENIX VTX detector clearly illustrate that this detector is working as expected and future heavy flavor physics program in PHENIX is very promising.
The most important achievement in this project, we had more than 40 summer high school students, graduate students, and postdocs during the construction and the commissioning of the VTX detector. Most of these students and postdocs had no prior experience to work with delicate and complex silicon detectors. After working with the VTX team for several months, those students left with high knowledge or have become "experts" of silicon detector technology.
References
- [1]
- I. Arsene et al. Nucl. Phys. A 757, (2005) 1; B.B.Back et al. Nucl. Phys. A 757, (2005) 28; J. Adams et al. Nucl. Phys. A 757, (2005) 102; K. Adcox et al. Nulc. Phys. A 757, (2005) 184.
- [2]
- R. Nouicer arXiv:0901.0910 [nucl-ex] and references therein.
- [3]
- Ryo Ichimiya, et al., Journal of Instrumentation, JINST 4 (2009) P05001.
- [4]
- Z. Li, Nucl. Instr. and Meth. A 518 (2004) 738.
- [5]
- R. Nouicer et al. Nucl. Instr. and Meth. B 261 (2007) 1067; R. Nouicer et al. Journal of Instrumentation, JINST 4 (2009) P04011.
- [6]
- http://www4.rcf.bnl.gov/ nouicer/TalkDir/BNLSeminar2011RN.ppt
Figure 1: Compilation of data on Au + Au collisions at √{sNN} ~200 GeV from Ref. [2]. Panel a) represents the nuclear modification factor of heavy-flavor electrons RAAHF compared with the RAA of π0 and π± in central Au + Au collisions. Panel b) considers the anisotropic flow of heavy-flavor electrons v2HF with that of v2 of π0 and π± in minimum-bias Au + Au collisions √{sNN} ~200 GeV. The error bars correspond to the statistical errors. For clarity, the systematic errors are shown as vertical boxes.
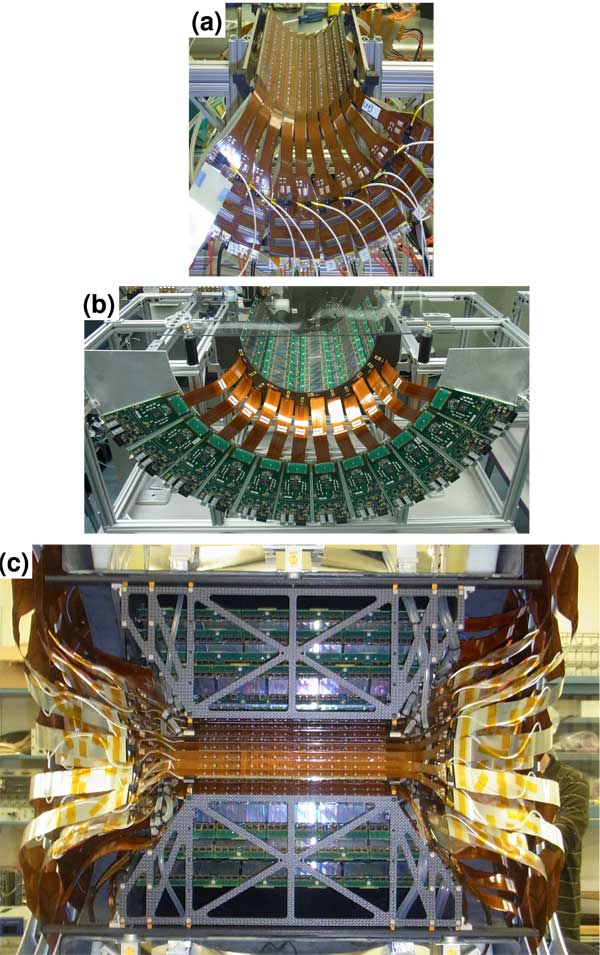
Figure 2: The PHENIX Silicon Vertex Tracker (VTX) in the Laboratory. Panels (a) and (b) show the ladders of half barrels of pixel and stripixel detectors, respectively. Panel (c) shows assembled half VTX.
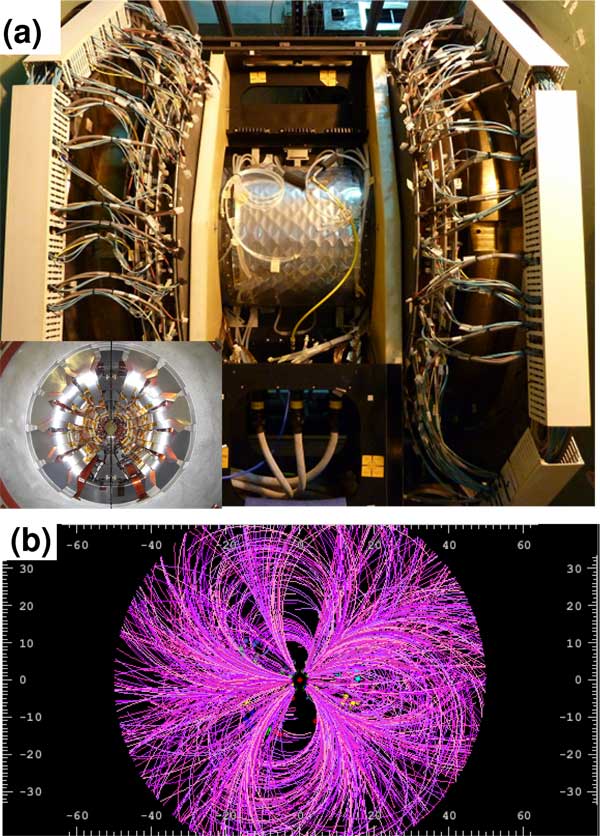
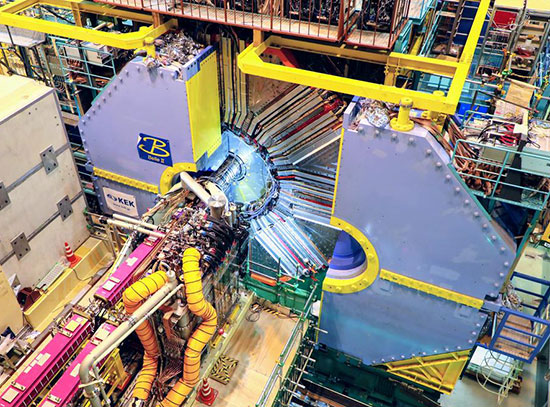
Figure 3: The PHENIX Silicon Vertex Tracker Commissioning. Panel (a) shows the side view of the VTX detector installed around the beam pipe at the PHENIX experiment. The inset figure in (a) shows the front (beam) view of VTX. Panel (b) shows the event display of a single Au + Au collision at 200 GeV from RHIC Run-11.
Figure 4: Performance results of the PHENIX Silicon Vertex Tracker Commissioning during Run-11. Panel (a) shows the energy deposition spectra in Au + Au at 200 GeV compared to p+p at 500 GeV for |η| < 0.5. Panel (b) shows the beam size of Au + Au collisions at 200 GeV obtained using the tracks from VTX detector. Panel (c) shows a very preliminary result of the distance of closest approach (DCA) distribution from the beam center of all tracks measured by the VTX.
2012-2960 | INT/EXT | Newsroom