First results from study of signals from slow particles
in low energy runs of Test Beam 98
(P. Decowski, A. Olszewski, H. Pernegger, P. Sarin)
In the Test Beam '98 experiment a substantial number of
runs was devoted to study properties of signals coming from low energy particles, may be
even stopping in the detector sensors. Such particles are expected to be of special
interest in the Phobos experiment and therefore it is important to find a good method to
find them among signals from other particles and to evaluate correctly their properties,
such as velocity or momentum.
In this page I am showing first results from my
attempts to extract signals from these low energy particles. In the low energy runs beams
of quite high energy particles were used. In order to obtain slow particles degrades were
used made of various materials and with various sizes. It was hoped to fit the size of the
degrader to obtain particles stopping inside the silicon planes of the Phobos sensors.
Out of the total of 87 runs, runs from number 40 to 87
were devoted to study stopping particles. Beams of 750 MeV/c and 550 MeV/c kaons and of
285 MeV/c pions were used with various trigger settings. Of them I have chosen for this
study the last set of runs starting with the number 64. They used a 550 MeV/c beam of
kaons with a trigger for effectively selecting pions and Fe degraders of sizes varying
from 12 inches to 13.5 inches.
Changes of energy distributions in
consecutive planes:
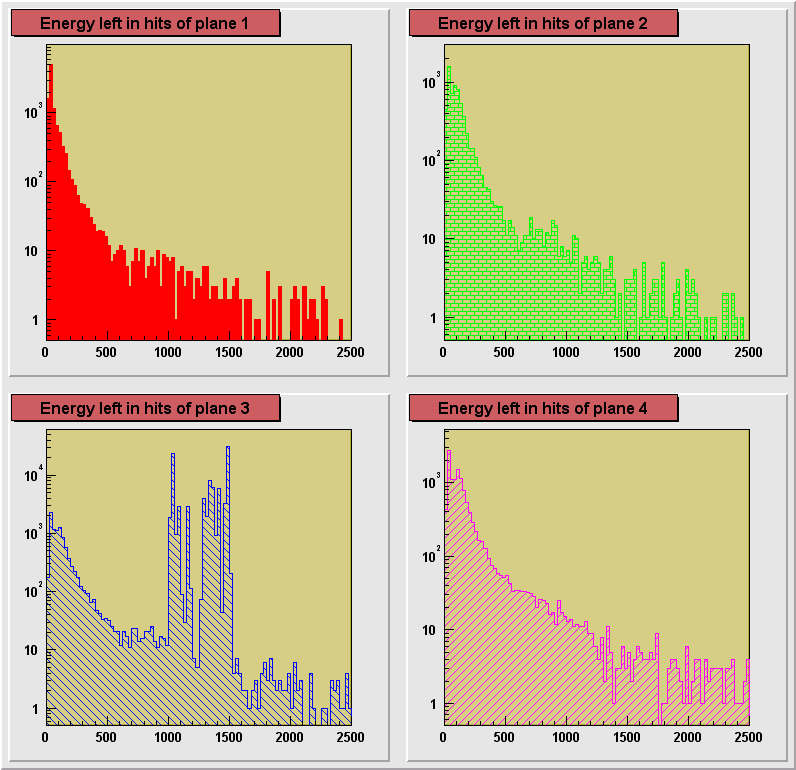
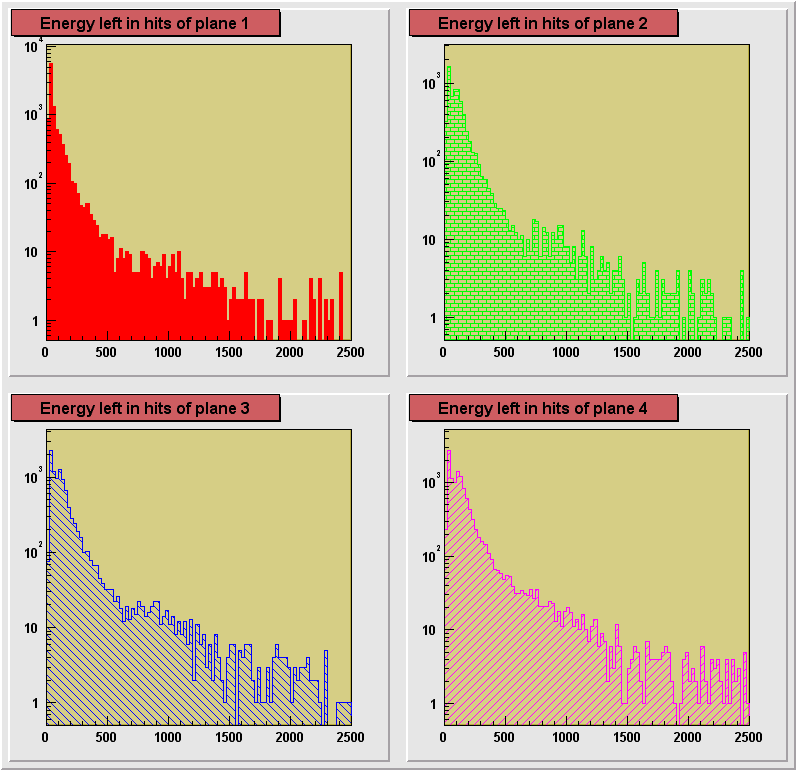
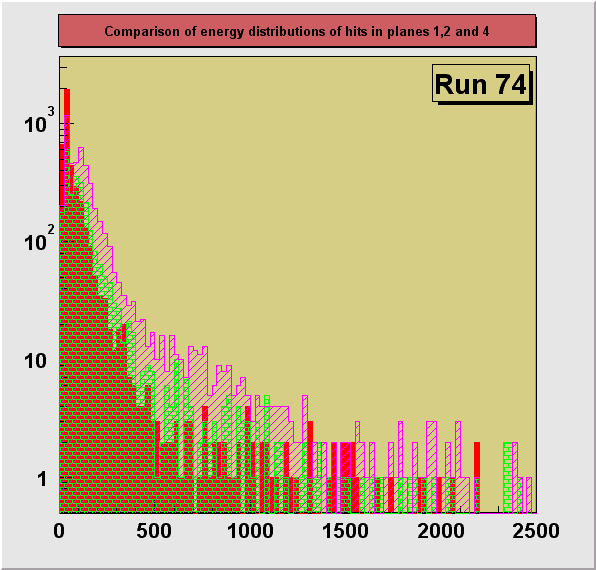
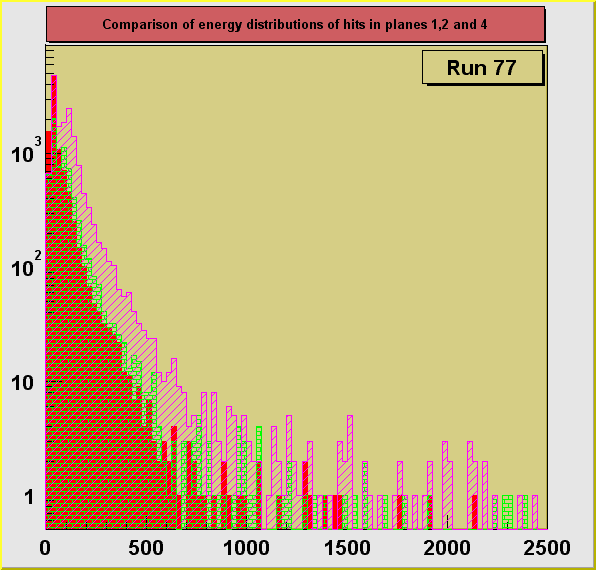
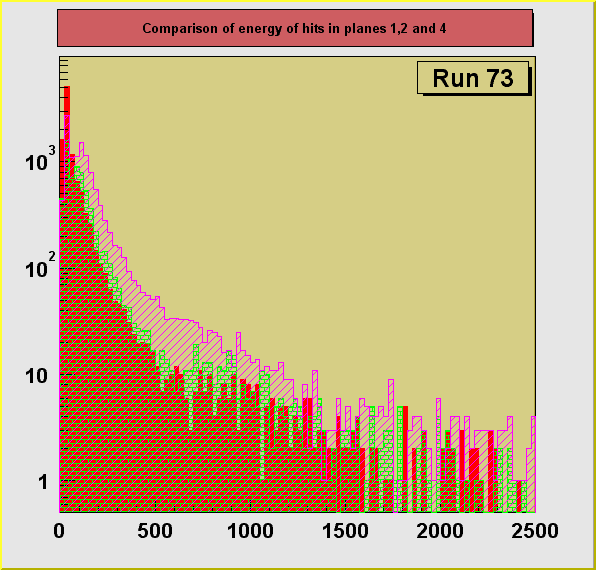
On the plots below a comparison of distributions of energy depositions
from hits in planes 1, 2 and 4. Plane 3 had some hot channels distorting the distribution
and is not shown here. The plots for separate runs are shown in
consecutive figures in the order of an increasing size of the degrader (decreasing average
energy of registered particles) : 0, 13.25, 13.31, 13.375, 13.44, 13.50 inches. A dependence of the particle ionization losses on the
changing primary energy, directly controlled by the size of the degrader can be seen. Also
an increase of the average energy deposition with the increasing plane number can be
seen. This is due to the loss of energy particle experiences in each of the planes it
crosses. Particles reaching the 4th plane has the lowest momentum on the average and
therefore ionization losses are the highest in this plane.
Changes of energy distributions in runs
with decreasing particle momenta:
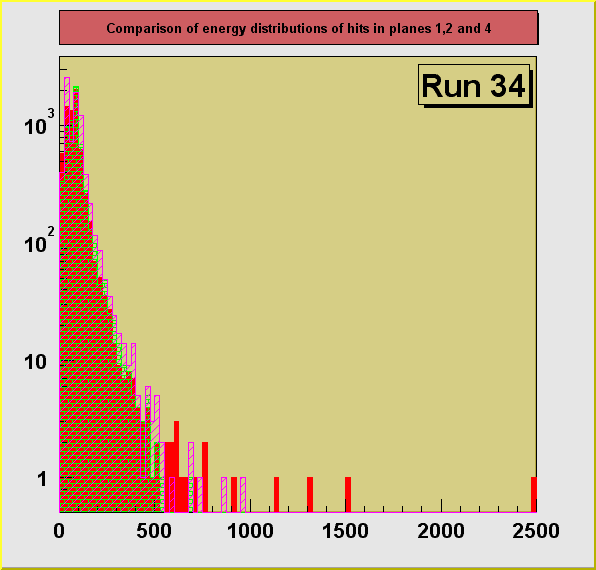
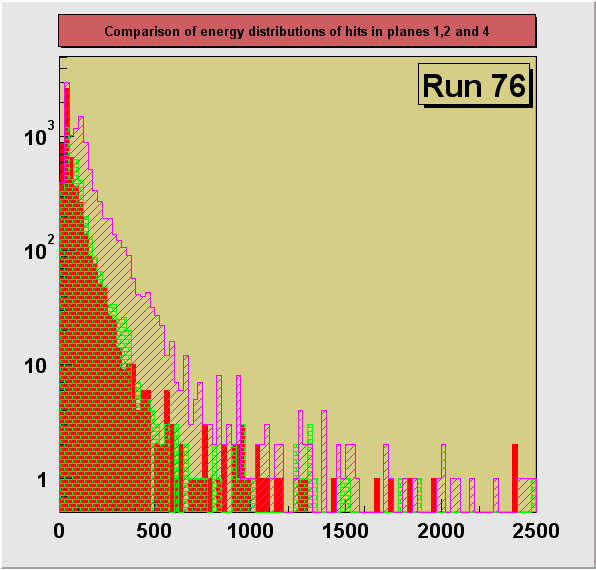
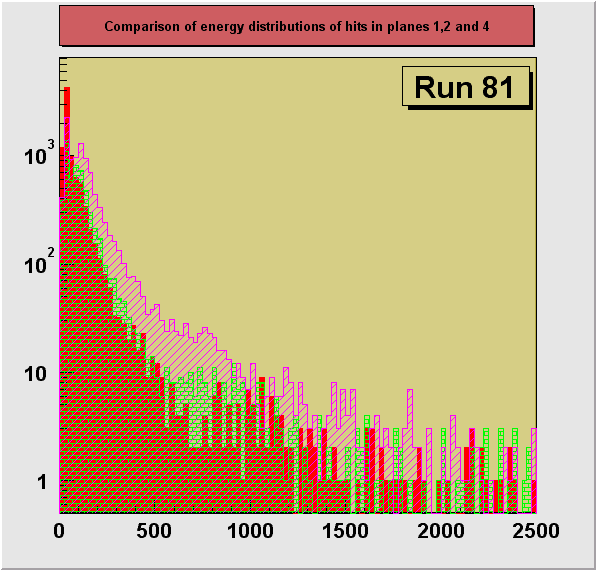
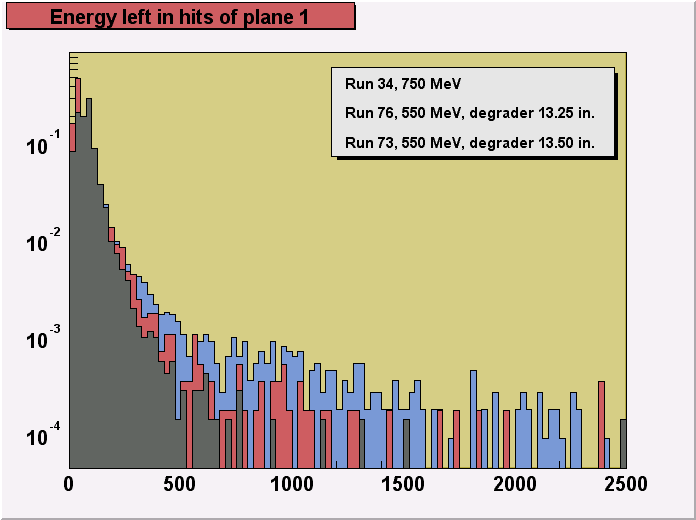
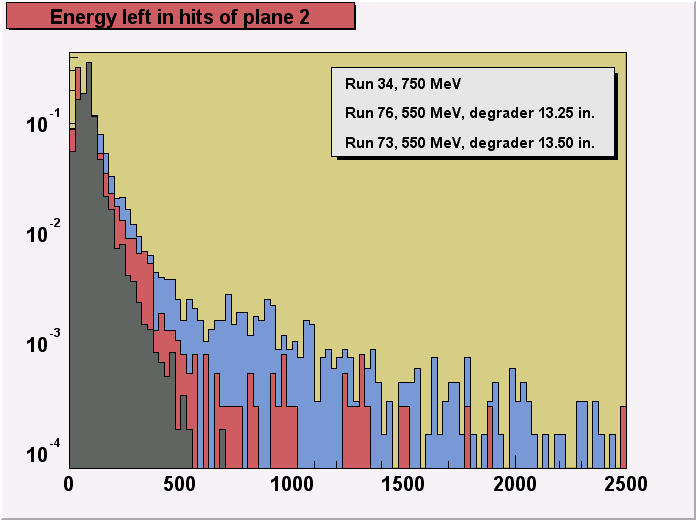
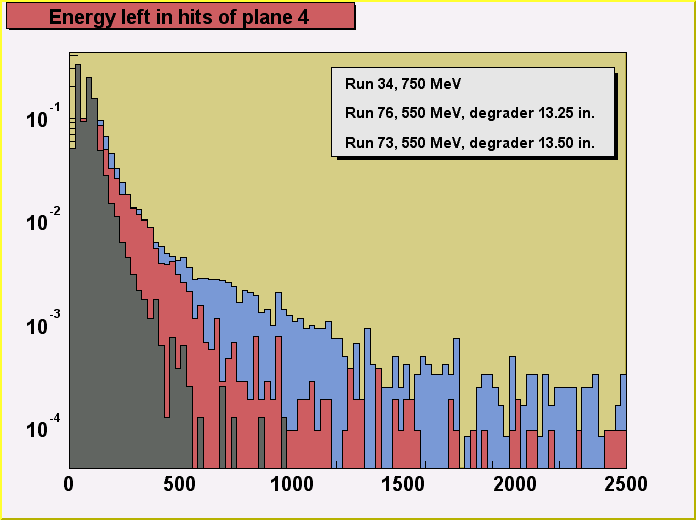
A more detailed comparison of distributions of energy of hits in each
of the sensor planes for particles with different energies, as controlled by the size of
the degrader, is shown on the 3 last figures (plane1,
plane 2, plane 4). The 3 chosen runs, 34, 76 and 73
differ strongly in particle momentum distributions. The most dramatic effect of increasing
energy deposition (ionization losses) with the decreasing particle momenta can be seen on
the figure for plane 4.
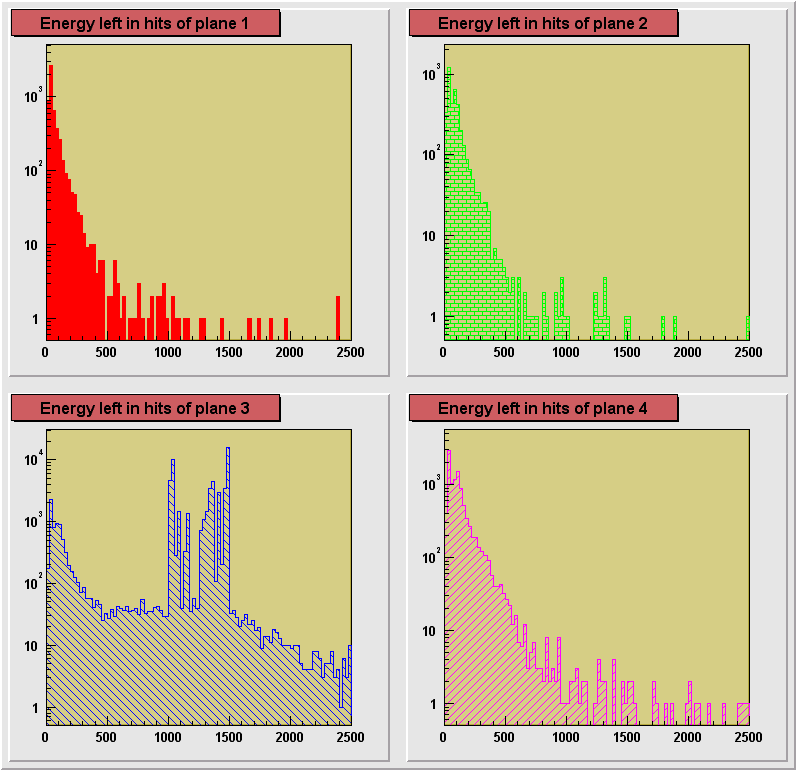
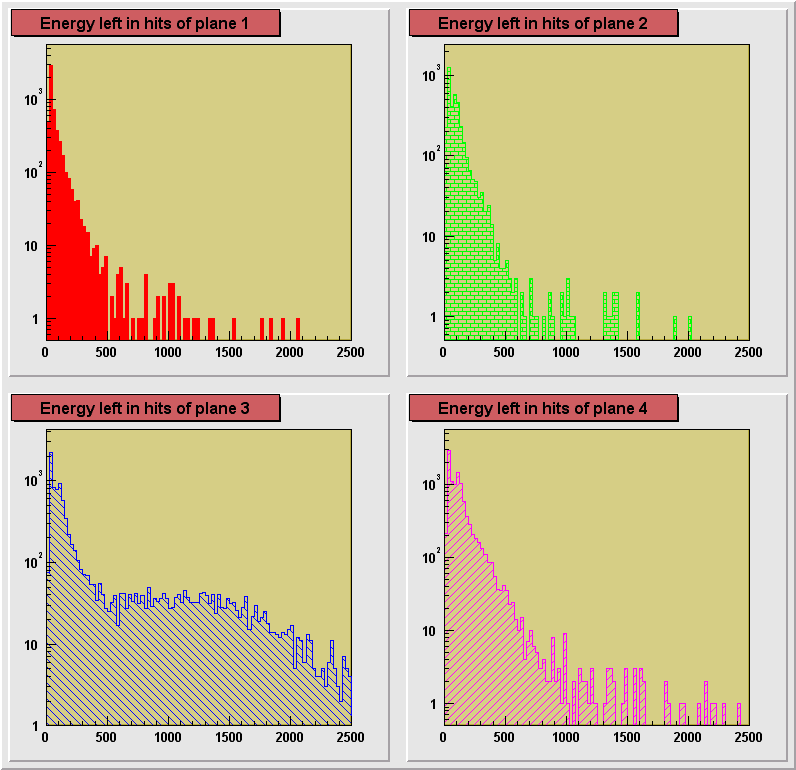
Hot channels in plane 3:
Effects of hot channel emulating signals has been observed in two
channels connected to plane 3 pads. They produced a large structure on the histogram of
energy depositions left by slow particles in the pads hit by them. The fake signals used
to overshadow the real signals from low energy particles due to their shear large number.
After removing these two channels (FEC9, String0, Channel0, and FEC9, String1, Channel0), see for example run 73, the structure is gone and a pure signal from stopping
particles can be seen also in plane 3. Only in run 76
there is still a general enhancement in the area of
large energy losses. This enhancement does not agree with the results of run 87 (with
the same size of the degrador). The final analysis of these effects will require
comparison with GEANT simulations.
|
|
| 750 MeV Kaon
beam, no degrader
550 MeV Kaon beam, effective pion beam, degrader 13.25 in.
Fe
550 MeV Kaon beam, effective pion beam, degrader 13.25+1/16
in. Fe
550 MeV Kaon beam, effective pion beam, degrader 13.375 in.
Fe
550 MeV Kaon beam, effective pion beam, degrader 13.25 +1/8
+1/16 in. Fe
550 MeV Kaon beam, effective pion beam, degrader 13.50 in.
Fe
|
Comparison
of distributions of hit energies left by low energy particles
in the silicon planes of the Test Beam '98 sensors
|
| 
|
Written by Andrzej Olszewski on 04/13/99


