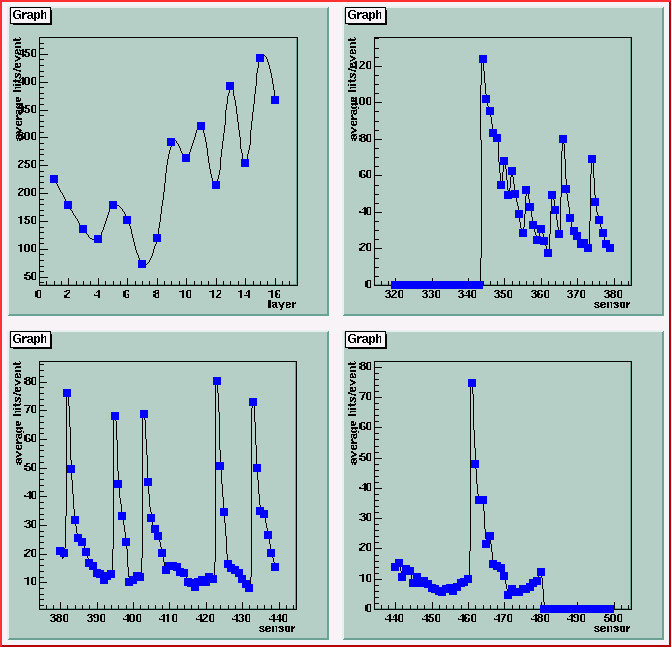
Study how hit frequency varies as a fn of B, vtx postition and centrality in spectrometer and vtx detector. Will also want to look at average angle of incidence for tracks:
Average number of hits/layer and hits/sensor for B=0 (20 central events, z vtx = 0) from venus_19990119_1_0_20.root:

Average number of hits/layer and hits/sensor for B=0 (50 inclusive events, z vtx = 0) from venus_19990323_3_0_50.root:
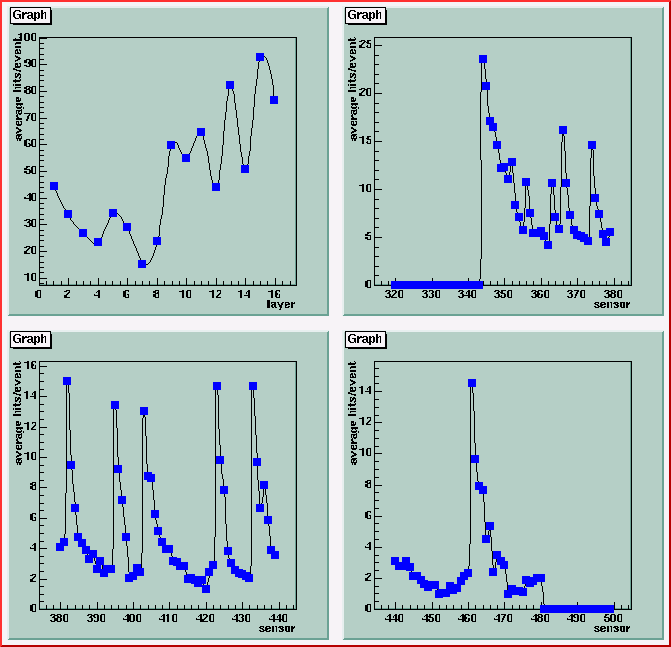
Average number of hits/layer and hits/sensor for field on events (10 central events, Zvtx=0) from cv0_10.root:

I don't understand why there are no sensors <408 in the cv0_10 sample. I brought over another sample of central events with B on ... Hijing, not Venus
Average number of hits/layer and hits/sensor for B on (20 central events, vtx=inclusive) from hijing_au100_19990408_1_0_400.adat.root: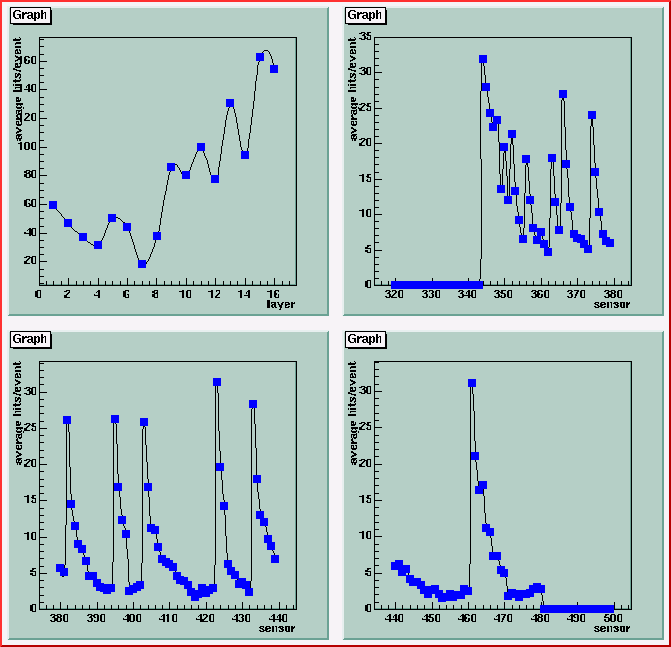
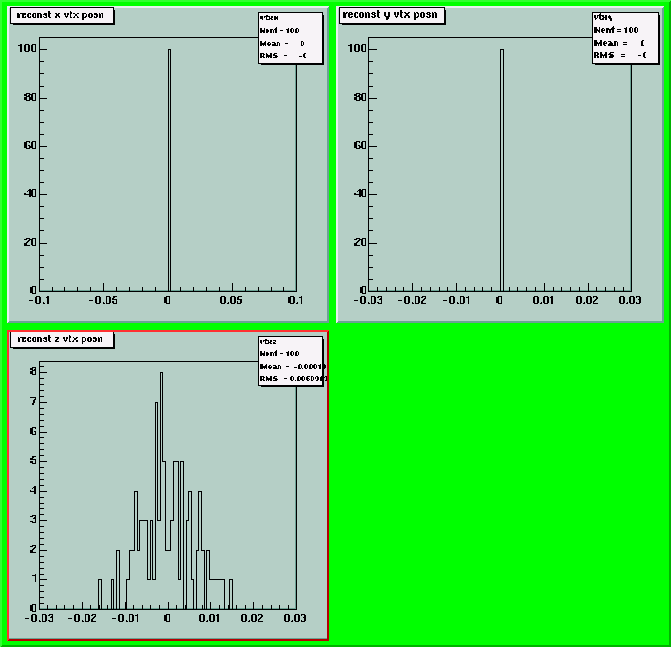
Reconstructed vertex positions for this sample:
There are substantially few hits in each layer/sensor (by factor of 2 or 3) for inclusive events vs. central events.
There are substantially fewer hits with field on ... as you might expect. The peaks occur for sensors closest to the beampipe.
I don't understand the sensor number pattern for my cv_0 sample from just after MDC1 time.
I don't understand the spread in the z vtx postion for the sample above. What are the units. If they are meters, then I see a spread of 1 cm. I thought the spread was supposed to be closer to 20 cm??
These are all hits. Many are not useful for alignment because they will not be associated with found tracks. I need to make similar plots for hits associated with findable tracks.
Plots for findable tracks (>11 hits on a track) 20 events, B off, inclusive centrality:
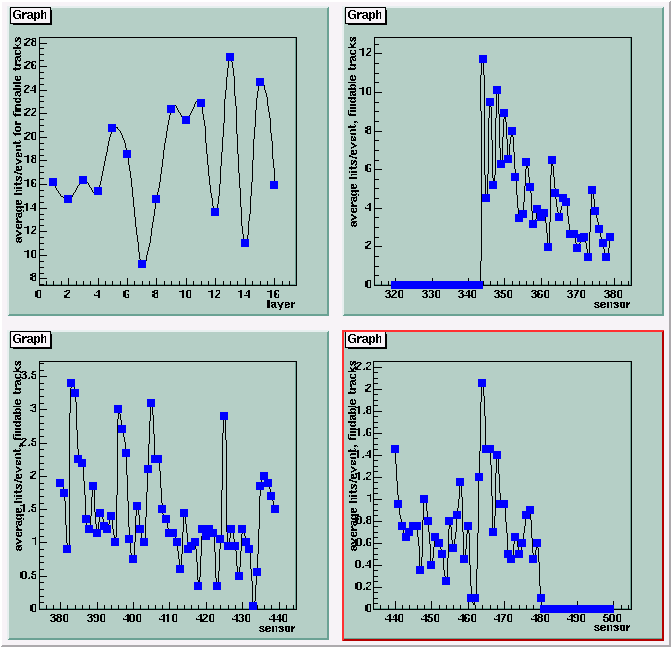
Findable tracks, B off, central events:
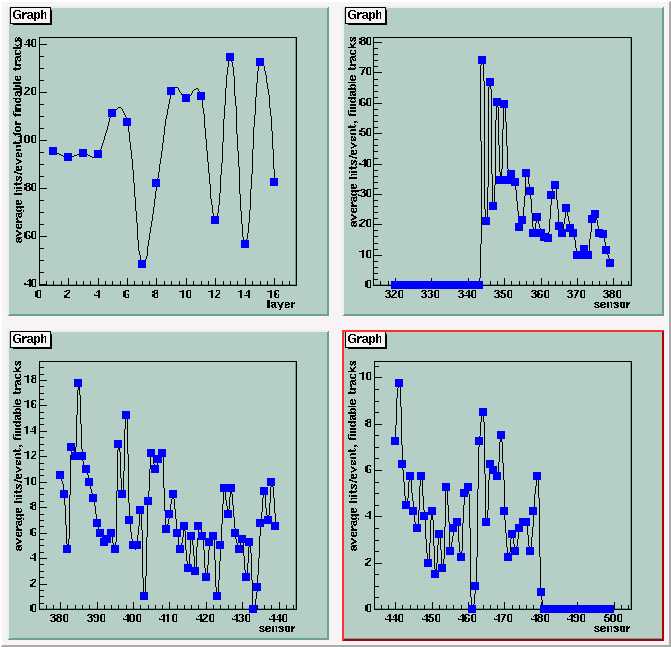
Findable tracks, field on, 4 central events, vtx position varies as shown above:
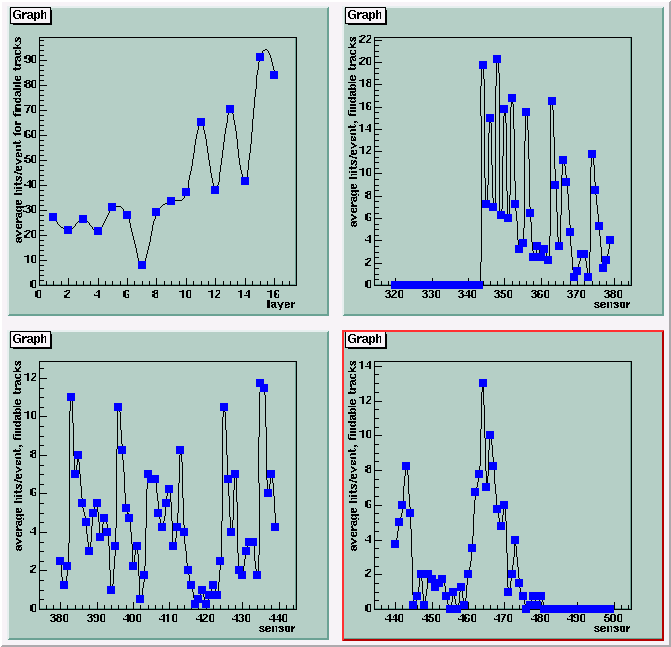
Create residual plots:
I need various components: MC hit positions, reconstr. hit positions, MC tracks, reconstructed tracks, sensor/pad/hit geometry relations, ability to swim track to find ideal position at a given sensor
What is relation between merged hit data classes - TPhRecHit, TPhRecMCHit - and the data classes - TPhHit, TPhMCHit?
Is the hit merging done prior to me finding the hit in TPhHit, i.e., do I only need worry about TPhHit info?
I know how to find hit positions in 3-space and on sensor for hits in TPhHit (for MC or reconstr hits). I know how to find MC track information.
Can I get/use reconstructed track information now? How?
Once I have a track (either MC or reconstructed) ... how do I determine the ideal hit position at a sensor for that track? Do I swim the track in an ideal trajectory until it intersects the plane at the center of the silicon plane of interest? If so, how is this done with Phobos?
How do I associate MC and reconstr. hits?