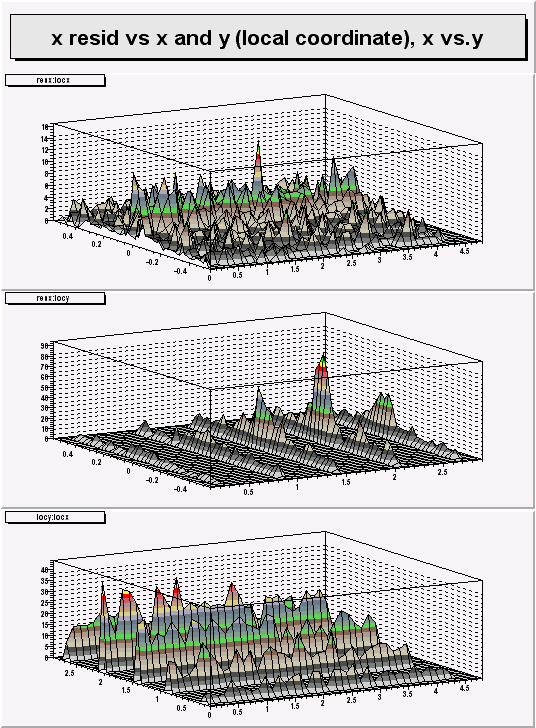
August 19, update on some ER alignment activities - S.M.
Looking at same data as in last report ... but modified plots to bring out more information.
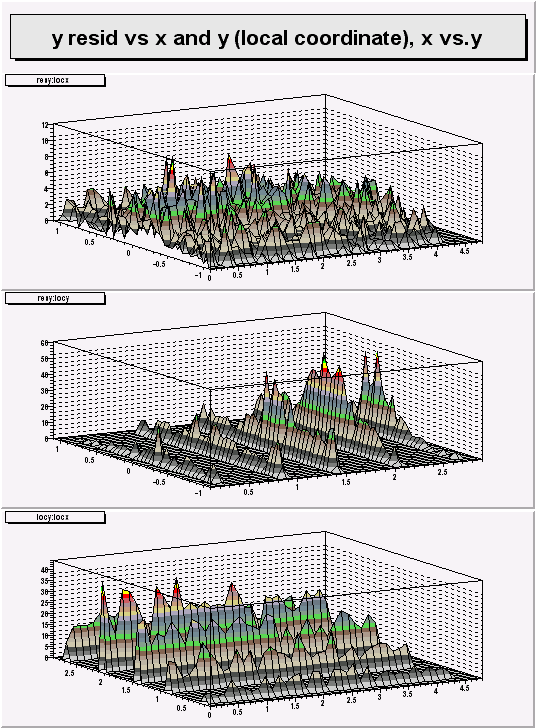
No cuts on found straight tracks. Below you will find the plots of x residual on the third plane as function of local x (top) and local y (middle). The bottom plot is the hit position local x vs local y. Using the surface draw feature one can see that most of the good tracks are hitting the top half of the sensor in y and all across the sensor in x.
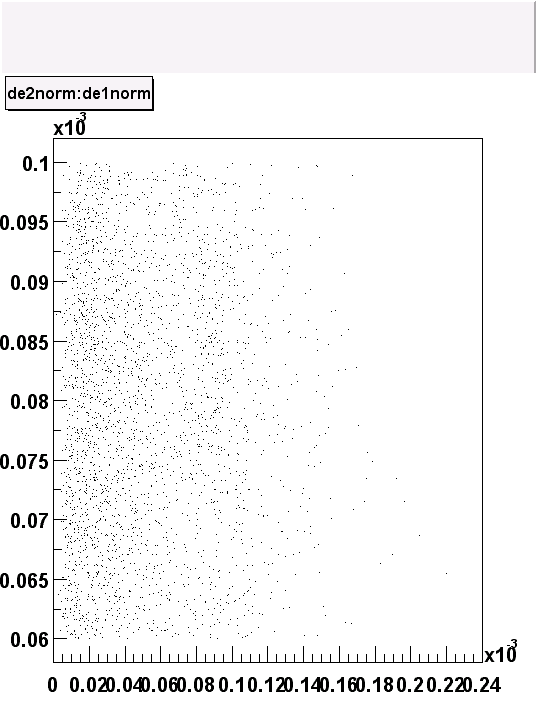
For the same data set (again with no cuts on the found tracks) I plot the deposited energy of the first layer against that for the second layer, where both are corrected (to normal incidence) for angle of incidence. Both plots are the same except for the range.
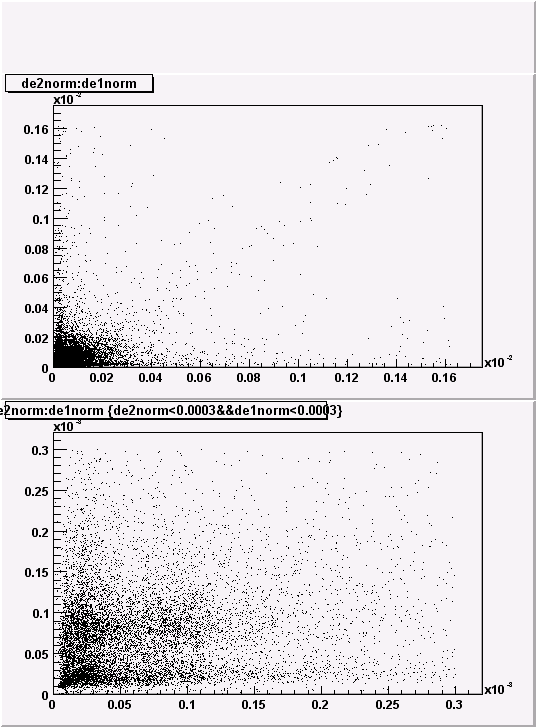
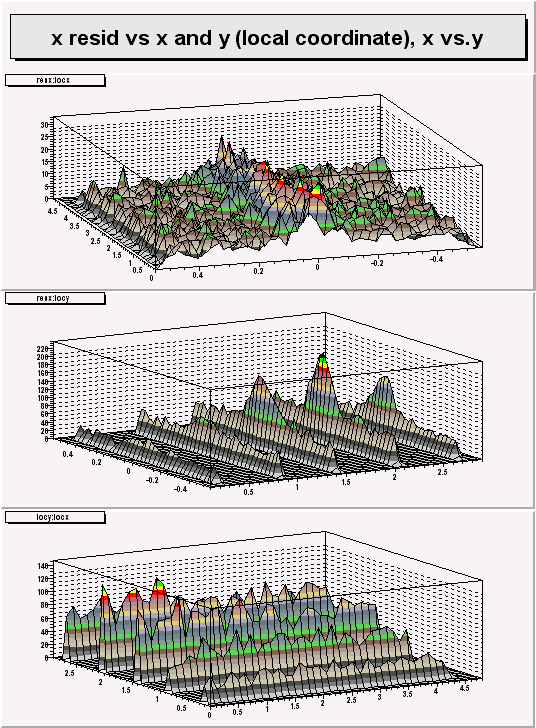
Now look at the residual plots (with surface plotting format) and the deposited energy scatter plot for the sample with deposited energy cuts in place exactly the same as that for the bottom of the last report.