Run 34
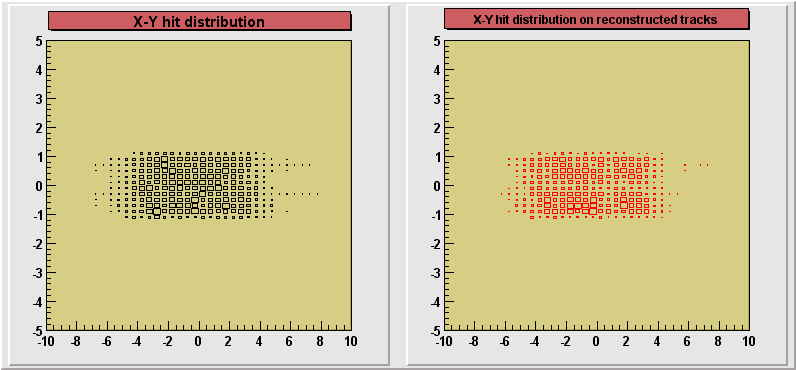
X-Y distribution of all hits (black) and those from reconstructed tracks (red)

(P. Decowski, A. Olszewski, H. Pernegger, P. Sarin)
Pedestal and noise levels in runs of the Test Beam '98 have been investigated with the current implementation of the raw signal processing procedure in Phat. Several runs have been chosen at random, and comparison of the changes in pedestal and noise levels during a single run and between the runs have been calculated. In general a trend of positive drift of pedestal values could be observed after 30,000 zero-suppressed events. A possible reason could be an inclusion of small signals from hits of real particles in calculations of the updated pedestal levels during zero-suppression procedure. In his mail Heinz Pernegger suggested to look into runs with lower energy beams, where a small finger detector was used to trigger events with well localized hits. Channels outside the geometrical position of the finger detector should be free of effects from particle hits.
You can follow the study below, or go directly to conclusions.
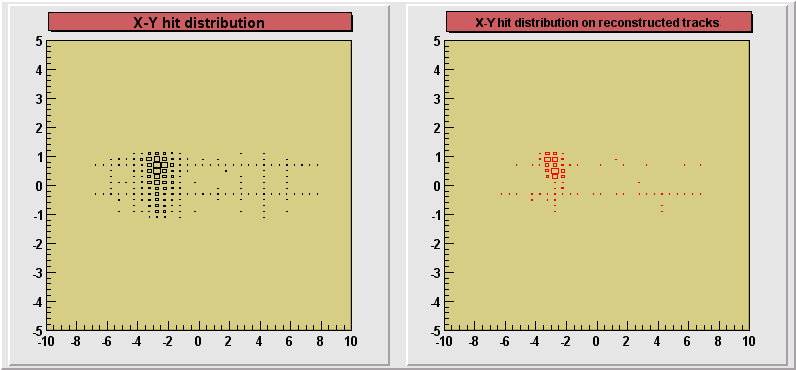
In the analysis below runs with numbers 73, 74, 76, 77 and 081 were taken into account. In these runs there is a well defined area at X[-4,-2] and Y[0,1]+[-1,0] (see below) where most of the reconstructed tracks is located. For the comparison, run 34 was also studied to see the difference as compared to runs with the finger detector trigger. A comparison of geometrical positions of hits is shown in the plots below for two runs, 34 first and for 73 on the second plot. The hits in the red color belong to the reconstructed tracks, obtained with the help of a simple use of the Phat TPhTrackSeedFinder, seed only finding method. The small number of reconstructed tracks in the run 73 is probably due to the low energy of primary particles in this run, after traversing 13.50 inches of Fe degrador.
Run 34 |
 |
Run 73 |
 |
It is indeed the area at X[-4,-2] and Y[0,1]+[-1,0] that is seen to be mostly occupied in run 73 (and all other runs with the run number 65 and higher, with a greater or smaller precision). This geometrical area corresponds to the channels belonging to the following chips:
| FEC no | String no | Chip no | Total chips |
0 |
1 | 2-3 |
9-10 |
| 0 | 3 | 2-3 | 21-22 |
| 1 | 1 | 2-3 | 33-34 |
| 1 | 3 | 2-3 | 45-46 |
| 8 | 0 | 2-3 | 51-53 |
| 8 | 2 | 2-3 | 63-65 |
| 9 | 0 | 2-3 | 75-76 |
| 9 | 2 | 2-3 | 87-88 |
To study the dependence of pedestal changes on the presence of particle hits in the channels of chips located in the area behind the finger detector a mean pedestal change for all the chips has been calculated. The plots below show the variation of means for runs 34 and 73. In the run 73 a pattern of large values of pedestal change (drift) can be seen exactly in the chips specified in the table above, where most signals is registered. Also in case of run 34 one can observe a pattern. This time it is a pattern of low pedestal drift values. The chips where these low drift is observed correspond to edges of sensor planes, where only a small number of signals is registered (see plot X-Y for run 34).
Run
10, 34 |
|
Run
73, 76 and 77 |
|
Each of the channels of the Test Beam '98 electronics can be assigned a specific position in space of the center of the sensor pad, to which this channel was connected. Instead of studying drift effects in the channels or chips, one can also look at the drift effects directly in the geometrical space. After a simple conversion one gets the following pictures for the investigated (34 nad 77) runs (the values on the Z axis are not properly normalized on these plots):
|
|
Conclusions:
From a very strong correlation between the
chips with large pedestal drift values and their position in space corresponding to the
area with the largest acceptance for signals from registered particles it is clear that
the main source of the drift in the pedestal values comes from the small signals that are
not accepted as hits but rather zero-suppressed and used in the procedure updating
pedestal levels in the channels of these chips. Since the occupancy in the Test Beam runs
was very low (from one to a few particles per event) and the low cut-off level in the
zero-suppressed procedure was used there is a danger of increased drift effects in the
real Phobos runs. The procedure of updating pedestal level with zero-suppressed signals
has to be rethinked in order to prevent from this happening.
Updated by Andrzej Olszewski on 04/13/99