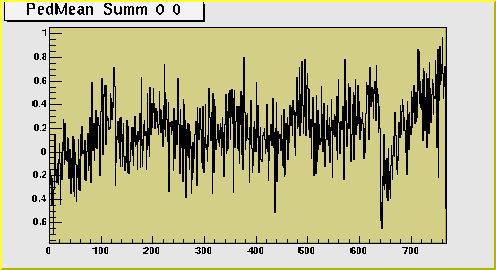
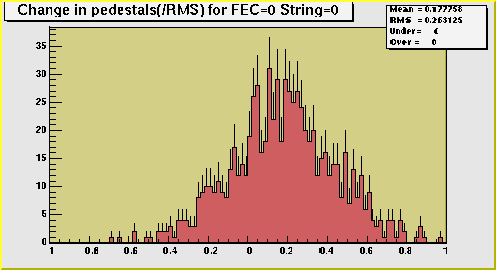
Example of
pedestal changes after 30000 events
Run 010
(FEC=0 String=0)
(P. Decowski, A. Olszewski, H. Pernegger, P. Sarin)
Pedestal levels and noise in signals registered in runs of the Test Beam '98 have been investigated. The pedestal and noise values have been calculated with their current implementation of calculation procedures in Phat. For the comparisons, several runs have been chosen, almost at random, and comparison of the changes in pedestal levels during a single run and between the runs have been calculated. In the following two-dimensional histograms, an average change of pedestal level is given on the Y axis and the RMS spread is given on the X axis. These plots are a summary of all the histograms obtained for the individual string series of channels in a particular run or a pair of runs.
For investigation of pedestal changes within a single run, five runs: 010, 034, 065, 069 and 087 have been used with a gap of 5000 events, two runs were used with a gap of 30000 events, and finaly four pairs of runs: 010-069, 034-069, 065-069 and 087-069 have been compared between themselves. With electronics consisting of 16 strings of 768 channels this provided 80 points in the 5000 gap histograms, 32 points in the 30000 histograms and 60 points in the different runs histograms, each point containing information from 768 channels.
Later, more runs have been studied. Runs nos 73, 74, 76, 77 and 81 have been chosen additionally in order to study the source of the effects of the pedestal drift. They are characteristic by their use of a small, finger trigger detector, limiting the geometrical area of the signal acceptance. The results of these studies are given elsewhere, but the summary of pedestal and noise stability results is presented on the pictures shown here in the blue color.
Pedestal stability:
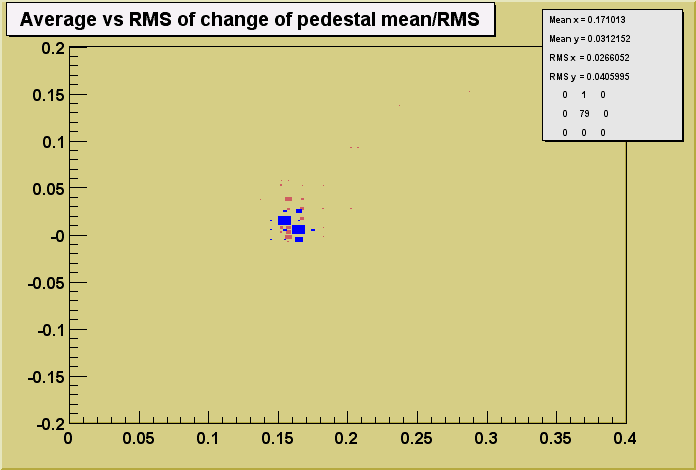
After 5000 events pedestal level changes on the average by 0.03 of the pedestal RMS, with RMS of this average 0.17.
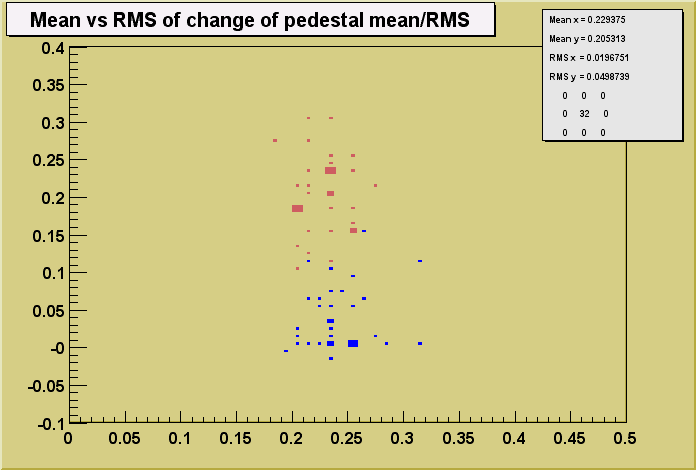
After 30000 events pedestal level changes on the average by 0.20 of the pedestal RMS, with RMS of this average 0.23.
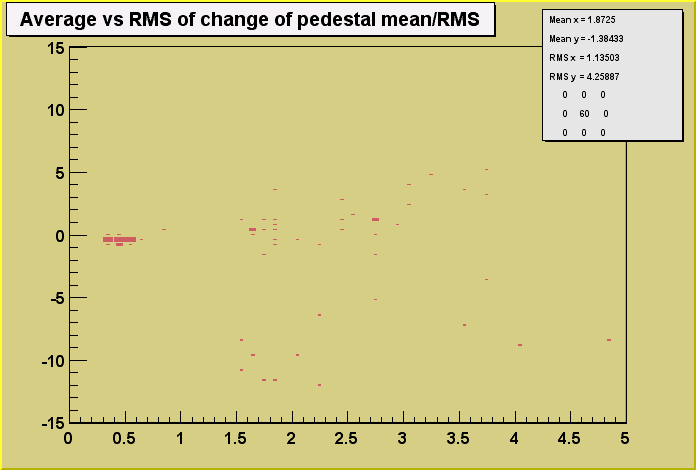
Between different runs these values vary wildly. The average is 1.38 and RMS 1.87.
With the increase of the time gap between the runs, the probability of large changes in the pedestal level increases. This is not seen directly on the histograms, since all pairs of runs are put on the same histogram, but several groups of points can be seen. They are coming from various pairs of runs, with a different time gap length.
The average value of pedestal change is close to 0 in the case of 5000 gap and small, in case of 30000 gap in the single run. The RMS values stay close to the value of 0.2, and an increase is seen when increasing the number of events gap. The results from runs 73 and 81 are shown in blue color. The average pedestal change in these runs is evidently smaller then in the batch of runs shown in red. The blue points come from runs where a small finger detector was used as a trigger. This limited the area where signals are being registered and evidently influenced the stability of pedestal levels, improving it very much. A deteiled discussion of this effect is given in a separate study.
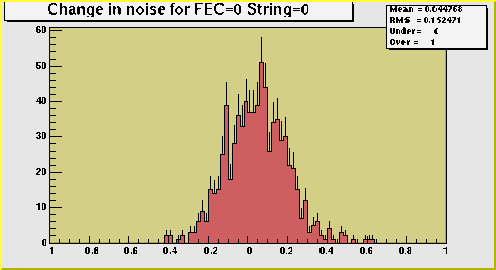
Noise stability:
After 5000 events noise level changes on the average by 0.031 of the ADC count, with RMS of 0.148.
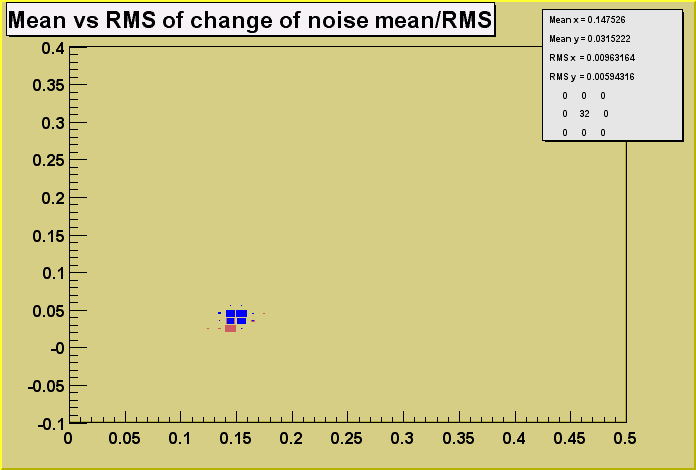
After 30000 events noise level changes on the average by 0.029 of the ADC count, with RMS of 0.149.
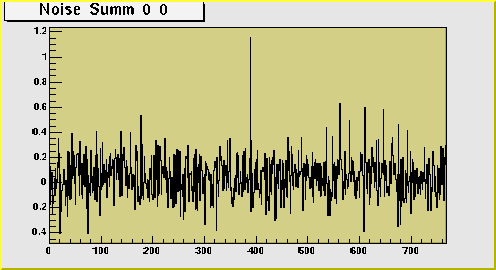
Noise levels seem to be very stable and don't change with the increase of the time gap between evaluation of the noise within the same run or between the runs.In order to give an idea how the distribution of pedestal and noise changes looks, below a distribution for a typical string of channels is shown. As one can see the changes in pedestal level may get close to 1 sigma, and noise changes up to 1 ADC after 30000 events in some channels. There are also runs where there are even more pronounced effects.
A full set of distributions and histograms for all investigated individual runs/strings in the first stage of the study is available for viewing.
Example of
pedestal changes after 30000 events
|
|
|
|
Example of noise
changes after 30000 events
|
|
 |
 |
Comparison of pedestal levels after 5000 events in the same run |
|
|
Comparison of pedestal levels after 30000 events in the same run |
|
|
Comparison of pedestal levels between the runs |
|
|
Comparison of noise levels after 5000 events in the same run |
|
|
Comparison of noise levels after 30000 events in the same run |
|
|
Written by Andrzej Olszewski on 04/13/99