Computation and Data-Driven Discovery (C3D) Projects
Software Tools to Study Structural Dynamics in Materials
New beamlines at the National Synchrotron Light Source II (NSLS-II) with high data payloads are in need of data analysis tools and streaming data analysis pipelines. High-throughput science experiments generate multidimensional data at a high rate.
The XPCS (X-ray Photon Correlation Spectroscopy) and XSVS (X-ray Speckle Visibility Spectroscopy) are two techniques used to study structural dynamics of various equilibrium and non-equilibrium processes occurring in condensed matter systems. Coherent Hard X-ray (CHX) and Coherent Soft X-ray (CSX-1) beamlines collect long series of images to study the dynamics of materials using XPCS and XSVS. This project is focused on developing an excellent set of data analysis tools and streaming data analysis pipelines to address the needs of these beamlines.
Already developed data analysis tools for studying the structural dynamics of materials are now available in github Scikit-beam repository (Scikit-beam project).
Scikit-beam
Scikit-beam is a python package originally being developed at the NSLS-II by the Data Acquisition, Management and Analysis (DAMA) group. This library is not only available for the beamlines of NSLS-II but also available for the broader scientific community. Now this is a multi-facilities effort, we have contributors from other Department of Energy (DOE) laboratories. The primary objective of Scikit-beam is to develop a comprehensive set of data analysis tools that minimize technique-specificity and, instead, maximize code re-usability. Our library supports a wide range of user expertise, from novice to developer. We also provide use case examples in Scikit-beam-examples for the tools included in Scikit-beam. They are in two formats: Jupyter (a.k.a Ipython notebooks) and python scripts. By providing both formats, users are able to learn to build analysis workflows using the tools included in Scikit-beam, and more advanced users can see, in detail, how to incorporate Scikit-beam into their own analysis scripts or programs.
Xray-vision
Visualization widgets and plotting tools for the data processing and analysis are available in the xray-vision repository.

Fig. 1. Manual Mask gui tool in xray-vision.
The image is an average over 5000 raw measurements with 1ms integration time (Left). The dark shadow of the beamstop, the dark columns in the scattering pattern and unwanted pixels are masked out using the manual mask gui tool (right) before analysis.
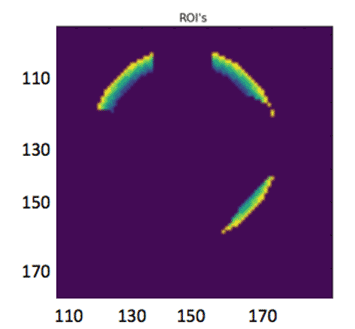
Figure 2. Ring-shaped ROI.
This figure represents 4 ring shaped region of interests (ROI’s) created using scikit-beam roi module. The ROI module contains software tools to generate ROI’s labeled arrays for simple shapes, such as, rectangles and concentric circles.
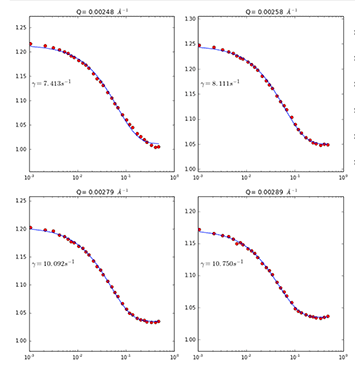
Figure 3. Multi_tau_auto_corr function in skbeam/correlation
Auto correlation function, g2(q, t) (red circles) calculated for 5000 masked images (Figure 1) using multi_tau_auto_corr function in skbeam. These g2(q,t) plotted as a function of time delay, t from the XPCS analysis over four q rings (Figure 2) of pixels at q=2.48x10⁻³Å-1, q=2.58x10⁻³Å-1, q=2.79x10⁻³Å-1 and q=2.89x10⁻³Å-1 (red circles) for masked image data. The experimental g2(q, t) plots (red circles) are fitted using auto_corr_scat_factor function in skbeam (blue line) for the XPCS analysis. These plots represent results form 5000 images. Streaming tools can be used to generate these results while the data is being collected. In this way, data quality can be determined on the fly, and change the scan strategy without interrupting the analysis, if needed.