The Sound of the Little Bangs
April 30, 2010
By Agnes Mocsy
Agnes Mocsy is a theoretical nuclear physicist and Assistant Professor at Pratt Institute in Brooklyn, NY.
We wondered what the aftermath of the collision of two gold ions traveling nearly at the speed of light would “sound” like, when the frequencies are converted to the frequency range of human hearing. So Paul Sorensen and I determined that sound starting from data taken at the Relativistic Heavy Ion Collider (RHIC) of Brookhaven Lab, and my student, Alex Doig, senior illustration major at Pratt Institute, accompanied it with illustrations and animations.
At RHIC physicists create matter as hot and dense as the universe was a millionth of a second after the Big Bang. For this reason, the collisions are sometimes called “little bangs”. When gold ions traveling at nearly the speed of light smash into each other a vast amount of energy (a large fraction of the 40 trillion electron volts from the colliding beams) is deposited into a tiny region in space, one millionth of one billionth of a meter across. This tiny speck of matter produced in these little bangs, the quark-gluon plasma (QGP), has been found [1] to behave like a liquid. The very hot fireball created in little bangs rapidly expands and cools. When cold enough, the quarks and gluons form composite particles called hadrons. Eventually the system spreads out enough that the hadrons stop interacting (this is often called the surface of last scattering) and free-stream to the detectors (see figure 1). So if a liquid-like QGP is created in these collisions then acoustic waves should be able to propagate through that matter. We look for evidence of acoustic phenomena and use available data to determine the sound of the little bangs. The acoustic picture we present is what an observer inside the QGP would “hear” as the system expands and cools. Our analysis of the frequency spectrum from momentum correlations is analogous to the analysis of the Cosmic Microwave Background (CMB) by the WMAP (Wilkinson Microwave Anisotropy Probe) of NASA [2] (see figure 2).
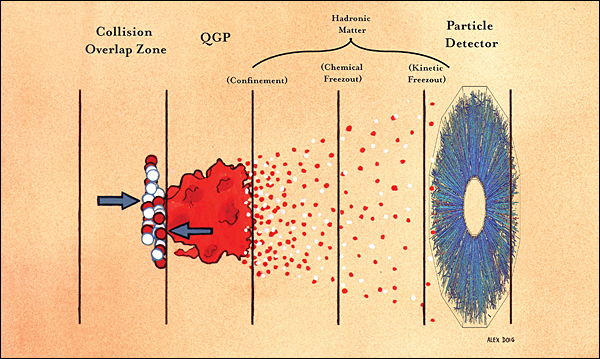
Figure 1. Collision of two gold nuclei and the subsequent evolution of the produced matter.
Because the colliding nuclei are lumpy, with high and low density regions, we expect the speck of QGP to start out lumpy. For the moment, we won’t dwell on the exact theory to describe these initial fluctuations, but only point out that the finite number of particles in the approaching nuclei implies that the density-fluctuations must be there. Density lumps at the start of the collisions can show up at the end, in the final-state momentum measurements. We expect this because the rapid expansion boosts these lumps outward [3]. If this is in fact the case, then we expect “hot spots” in the surface of last scattering. These over-densities and under-densities are similar to the over-densities and under-densities that show up as hotspots (temperature-fluctuations) in the cosmic microwave background radiation (see figure 2).
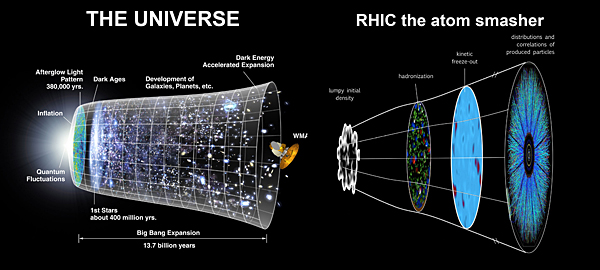
Figure 2. A schematic of the expansion of the universe and a schematic of the expansion of a collision between gold nuclei.
The CMB temperature-fluctuations arise from quantum-fluctuations in the early universe, which are then stretched to cosmic sizes by inflation, and propagated as density, or sound waves in the early universe, and they ultimately explain why the universe contains the structure that it does. So just like quantum fluctuations in the early universe show up in the CMB, we expect to see fluctuations from the beginning of the little bangs in the tracks in the detectors. But there is a difference: Measuring temperature-fluctuations in the CMB required extremely precise temperature measurements at more than two million points in the sky, each of which requires enough photons to be observed to reconstruct the black-body spectrum from which the temperature is determined. But in the little bangs created in the laboratory, only a few thousand particles can be created at once, so a similar map cannot be made for each event. But whereas we can only observe one universe, billions of collisions are created in the lab.
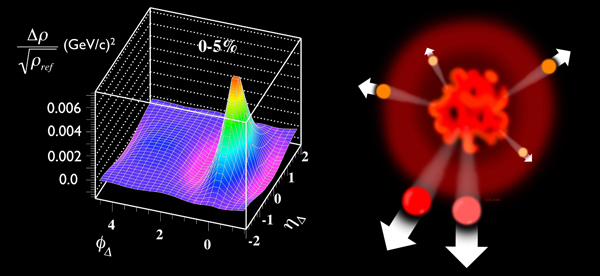
Figure 3. Left panel: Two-particle momentum correlation measurements versus relative angle of separation and pseudorapidity from the STAR Collaboration [2]. Right panel: Fast particles come out together after the collisions.
By studying data accumulated from millions of these collisions, we search for evidence of hotspots in the surface of last scattering. Our starting point is the data for two-particle momentum correlation for different relative angles between particles [4] (see left panel figure 3). What the narrow peak positioned around small angle separation tells us is that particles with above average momentum usually come out together (see right panel figure 3). In other words: if a particle comes out with a momentum above average then the nearby particles also tend to have momenta above the average. This is what we expect from hotspots on the surface of last scattering, since high temperature regions will tend to generate higher momentum particles. The correlation of these fast particles suggests that they are born out of the same high density high temperature lump. Further emerging evidence to support this picture comes also the improved description of particle spectra when temperature fluctuations are considered [5]. So the initial density fluctuations seem to show up as hotspots in the final decoupling stage, which then propagate to the detectors. The correlation data gives us information about the temperature and density fluctuations on the surface of last scattering. Since sound is nothing more than the propagation of a density wave through a medium, the data is telling us about the sound at the final moments of the collisions.
Figure 4. The power spectrum versus harmonic number, determined as the Fourier-transform of the correlation function of figure 3 at zero rapidity difference (delta y = 0).
We first determined the final sound: We took a slice of the momentum correlations function at mid-rapidity [4] and Fourier-transformed this correlation function versus relative azimuthal angle [6]. This way we generated the azimuthal power spectrum, i.e. we determined the frequencies and the strength with which these manifest at the end of the collision (see figure 4). But to know how this sound developed, we also determined how the acoustic horizon expanded with time. Just like the horizon defines how far we can see, the acoustic horizon defines what sounds we can hear. Thus the acoustic horizon gives us a rough idea of how the sound changes with time: Initially, only the shortest of wavelengths can fit inside the horizon, so we hear the higher tones first. Then, as time passes the horizon expands, and once half a wavelength fits inside of it, these new longer wavelengths and lower tones become audible. Finally, as the system becomes too cool and too spread out to interact anymore, we hear the final note before the silence of vacuum. We needed to know the time evolution of the speed of sound in the medium to determine the acoustic horizon. The speed of sound versus energy density has been calculated from lattice QCD [7] and the energy density versus time has been calculated in a hydrodynamic calculation [8]. We put these two together to get find the speed of sound versus time and the acoustic horizon.
We scaled the frequencies to be audible to the human ear by approximately a factor of 1019.
So here is the full acoustic picture of the collisions, the sound of the little bangs, as the listener inside the horizon would hear it.
Links
- The YouTube presentation
- The website
- The sound (.wmv sound only)
- The sound with the acoustic horizon (sound and visual)
References
[1] M. Gyulassy and L. McLerran, Nucl. Phys. A 750: 30-63 (2005); M. Riordan and W. Zajc, Sci. Am. 294N5: 24-31 (2006)
[2] A. P. Mishra, et al. Phys. Rev. C77, 064902, (2008); P. Sorensen, proceedings of Winter Workshop 2008.
[3] S. Voloshin, Phys. Rev. B 632 (2006)
[4] J. Adams, et al. (STAR Collaboration), J. Phys. G 32 (2006) 3
[5] Z. Tang et al, Phys. Rev. C 79, 051901 (R) (2009)
[6] T. A. Trainor and D. T. Kettler, Int. J. Mod. Phys. E17, 1219-1272 (2008)
[7] A. Bazavov et al., Phys. Rev. D 80 (2009), 014504
[8] Kolb, P., Heavy Ion Phys. 21, 243-248, (2004)
2010-1795 | INT/EXT | Newsroom