No Need to Mind The Gap: Astrophysicists Fill In 11 Billion Years of Our Universe's Expansion History
July 20, 2020
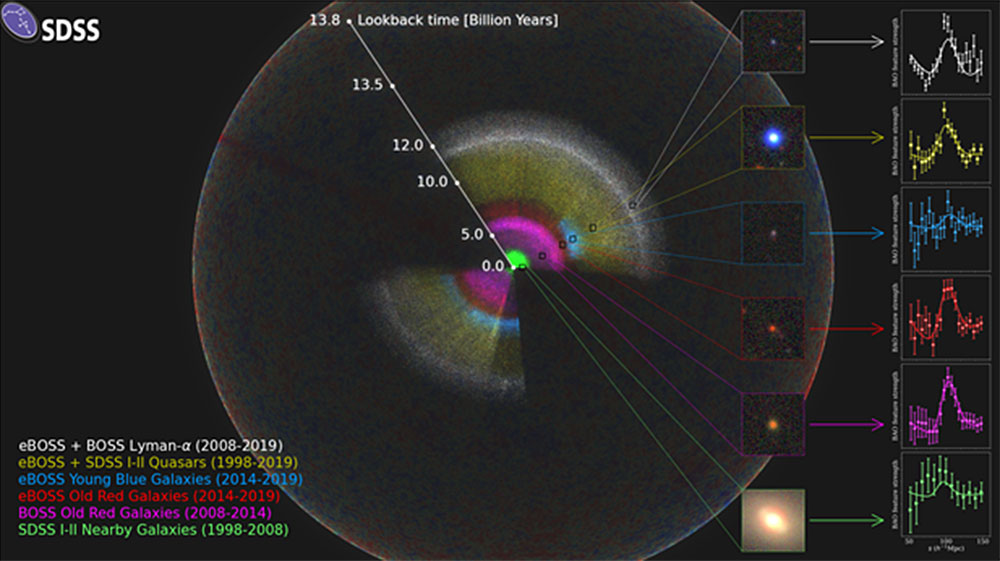
The SDSS map is shown as a rainbow of colors, located within the observable Universe (the outer sphere, showing fluctuations in the Cosmic Microwave Background). We are located at the center of this map. The inset for each color-coded section of the map includes an image of a typical galaxy or quasar from that section, and also the signal of the pattern that the eBOSS team measures there. The bump visible in each panel is at the characteristic scale of about 500 million lightyears. As we look out in distance, we look back in time. So, the location of these signals reveals the expansion rate of the Universe at different times in cosmic history. Credit: Anand Raichoor (EPFL), Ashley Ross (Ohio State University) and SDSS.
The following news release was originally issued by the Sloan Digital Sky Survey (SDSS). It describes how an SDSS component survey called the extended Baryonic Oscillation Spectroscopic Survey (eBOSS) has made detailed measurements of more than two million galaxies and quasars over 11 billion years of cosmic time, providing new insight on the universe's expansion and the nature of dark energy. The U.S. Department of Energy's (DOE) Brookhaven National Laboratory is a member of the eBOSS collaboration and played key roles in this work. Brookhaven Physicist Erin Sheldon helped develop experiment infrastructure, which was first used in BOSS, a precursor experiment, and then repurposed for eBOSS. Brookhaven Physicist Anže Slosar was heavily involved in measuring and interpreting the final cosmology constraints. For more information on Brookhaven's role in this work, contact Stephanie Kossman (skossman@bnl.gov, 631-344-8671).
The Sloan Digital Sky Survey (SDSS) released today a comprehensive analysis of the largest three-dimensional map of the Universe ever created, filling in the most significant gaps in our possible exploration of its history.
“We know both the ancient history of the Universe and its recent expansion history fairly well, but there’s a troublesome gap in the middle 11 billion years,” says cosmologist Kyle Dawson of the University of Utah, who leads the team announcing today’s results. “For five years, we have worked to fill in that gap, and we are using that information to provide some of the most substantial advances in cosmology in the last decade.”
The new results come from the extended Baryon Oscillation Spectroscopic Survey (eBOSS), an international collaboration of more than 100 astrophysicists that is one of the SDSS’s component surveys. At the heart of the new results are detailed measurements of more than two million galaxies and quasars covering 11 billion years of cosmic time.
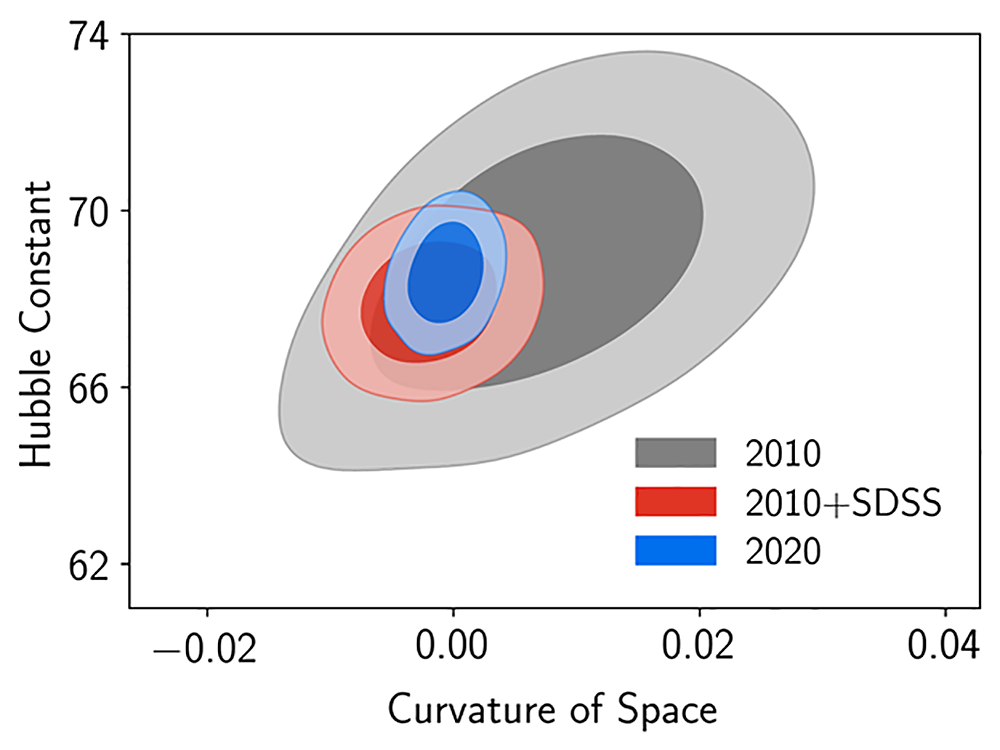
This image illustrates the impact that the eBOSS and SDSS maps have had on our understanding of the current expansion rate and curvature of the Universe from the last 20 years of work. The gray region shows our knowledge as of 10 years ago. The blue region shows the best current measurement, which combines SDSS, eBOSS and other programs. The decreasing sizes of the colored regions show how our knowledge of the expansion rate has improved. The contribution of the SDSS data to this improvement is shown by the red region. The measurements of the curvature of the Universe are shown on the horizontal axis. The eBOSS results, which hone in on zero, suggest the Universe is flat, and improve significantly on constraints from other experiments. The vertical axis shows the current expansion rate of the Universe (the Hubble Constant). The Hubble Constant measurements from SDSS and other surveys are inconsistent with the measurements from nearby galaxies, which find a value close to 74 in these units, as opposed to 68 for the SDSS. Only with the data taken from eBOSS and other experiments in the last decade has it been possible to reveal this discrepancy. Credit: Eva-Maria Mueller (Oxford) and SDSS.
We know what the Universe looked like in its infancy, thanks to the thousands of scientists from around the world who have measured the relative amounts of elements created soon after the Big Bang, and who have studied the Cosmic Microwave Background. We also know its expansion history over the last few billion years from galaxy maps and distance measurements, including those from previous phases of the SDSS.
“Taken together, detailed analyses of the eBOSS map and the earlier SDSS experiments have now provided the most accurate expansion history measurements over the widest-ever range of cosmic time,” says Will Percival of the University of Waterloo, eBOSS’s Survey Scientist. “These studies allow us to connect all these measurements into a complete story of the expansion of the Universe.”
The final map is shown in the accompanying image. A close look at the map reveals the filaments and voids that define the structure in the Universe, starting from the time when the Universe was only about 300,000 years old. From this map, researchers measure patterns in the distribution of galaxies, which give several key parameters of our Universe to better than one percent accuracy. The signals of these patterns are shown in the insets in the image.
In this short video produced by the Perimeter Institute (PI), eBOSS Principle Investigator, Kyle Dawson (Utah), eBOSS Project Scientist, Will Percival (Waterloo and PI) and Jiamin Hou (a PhD student from Max Planck Institute for Extragalactic Physics who led some of the eBOSS analysis), discuss the results SDSS-IV and eBOSS have released today, how the eBOSS project is run, and the impact the results have on our understanding of the Universe. Credit: Perimeter Institute and SDSS.
This map represents the combined effort of more than 20 years of mapping the Universe using the Sloan Foundation telescope. The cosmic history that has been revealed in this map shows that about six billion years ago, the expansion of the Universe began to accelerate, and has continued to get faster and faster ever since. This accelerated expansion seems to be due to a mysterious invisible component of the Universe called “dark energy,” consistent with Einstein’s General Theory of Relativity but extremely difficult to reconcile with our current understanding of particle physics.
Combining observations from eBOSS with studies of the Universe in its infancy reveals cracks in this picture of the Universe. In particular, the eBOSS team’s measurement of the current rate of expansion of the Universe (the “Hubble Constant”) is about 10 percent lower than the value found from distances to nearby galaxies. The high precision of the eBOSS data means that it is highly unlikely that this mismatch is due to chance, and the rich variety of eBOSS data gives us multiple independent ways to draw the same conclusion.
“Only with maps like ours can you actually say for sure that there is a mismatch in the Hubble Constant,” says Eva-Maria Mueller of the University of Oxford, who led the analysis to interpret the results from the full SDSS sample. “These newest maps from eBOSS show it more clearly than ever before.”
This video builds up the SDSS map of the Universe over the 20 years of mapping, shows a fly through of the data, and ends with the view of the map we provide as a static image. Credit: Anand Raichoor (EPFL), Ashley Ross (Ohio State University) and SDSS.
There is no broadly accepted explanation for this discrepancy in measured expansion rates, but one exciting possibility is that a previously-unknown form of matter or energy from the early Universe might have left a trace on our history.
In total, the eBOSS team made the results from more than 20 scientific papers public today. Those papers describe, in more than 500 pages, the team’s analyses of the latest eBOSS data, marking the completion of the key goals of the survey.
Within the eBOSS team, individual groups at Universities around the world focused on different aspects of the analysis. To create the part of the map dating back six billion years, the team used large, red galaxies. Farther out, they used younger, blue galaxies. Finally, to map the Universe eleven billion years in the past and more, they used quasars, which are bright galaxies lit up by material falling onto a central supermassive black hole. Each of these samples required careful analysis in order to remove contaminants, and reveal the patterns of the Universe.
In this video, SDSS-IV Director, Mike Blanton (NYU) and eBOSS Project Scientist, Will Percival (Waterloo and PI) discuss the overall impact of 20 years of SDSS cosmological mapping and making data publicly available to the public. Credit: Perimeter Institute and SDSS.
“By combining SDSS data with additional data from the Cosmic Microwave Background, supernovae, and other programs, we can simultaneously measure many fundamental properties of the Universe,” says Mueller. “The SDSS data cover such a large swath of cosmic time that they provide the biggest advances of any probe to measure the geometrical curvature of the Universe, finding it to be flat. They also allow measurements of the local expansion rate to better than one percent.”
eBOSS, and SDSS more generally, leaves the puzzle of dark energy, and the mismatch of local and early Universe expansion rate, as a legacy to future projects. In the next decade, future surveys may resolve the conundrum, or perhaps, will reveal more surprises.
Meanwhile, with continued support from the Alfred P. Sloan Foundation and institutional members, the SDSS is nowhere near done with its mission to map the Universe. Karen Masters of Haverford College, Spokesperson for the current phase of SDSS, described her excitement about the next phase. “The Sloan Foundation Telescope and its near-twin at Las Campanas Observatory will continue to make astronomical discoveries mapping millions of stars and black holes as they change and evolve over cosmic time.” The SDSS team is busy building the hardware to start this new phase and is looking forward to the new discoveries of the next 20 years.
This video fly through of our map of the Universe explains 20 years of cosmology mapping with the Sloan Digital Sky Survey and the significance for understanding the expansion of the Universe. Parts of the fly through are used in the Perimeter Institute videos. Credit: EPFL and SDSS.
Contacts
Will Percival
eBOSS Survey Scientist
University of Waterloo & Perimeter Institute
will.percival@uwaterloo.ca
+1-519-570-6806
Kyle Dawson
eBOSS Principal Investigator
University of Utah
kdawson@astro.utah.edu
Eva-Maria Mueller
Postdoctoral Research Fellow
University of Oxford
eva.mueller@physics.ox.ac.uk
Karen Masters
SDSS-IV Scientific Spokesperson
Haverford College
klmasters@haverford.edu
+1-610-202-6660
@KarenLMasters / @SDSSurveys
Jordan Raddick
SDSS Public Information Officer
Johns Hopkins University
raddick@jhu.edu
+1-443-570-7105
Acknowledgments
Funding for the Sloan Digital Sky Survey IV has been provided by the Alfred P. Sloan Foundation, the U.S. Department of Energy Office of Science, and the Participating Institutions. SDSS acknowledges support and resources from the Center for High-Performance Computing at the University of Utah. The SDSS web site is www.sdss.org.
SDSS is managed by the Astrophysical Research Consortium for the Participating Institutions of the SDSS Collaboration including the Brazilian Participation Group, the Carnegie Institution for Science, Carnegie Mellon University, the Chilean Participation Group, the French Participation Group, Harvard-Smithsonian Center for Astrophysics, Instituto de Astrofísica de Canarias, The Johns Hopkins University, Kavli Institute for the Physics and Mathematics of the Universe (IPMU) / University of Tokyo, the Korean Participation Group, Lawrence Berkeley National Laboratory, Leibniz Institut für Astrophysik Potsdam (AIP), Max-Planck-Institut für Astronomie (MPIA Heidelberg), Max-Planck-Institut für Astrophysik (MPA Garching), Max-Planck-Institut für Extraterrestrische Physik (MPE), National Astronomical Observatories of China, New Mexico State University, New York University, University of Notre Dame, Observatório Nacional / MCTI, The Ohio State University, Pennsylvania State University, Shanghai Astronomical Observatory, United Kingdom Participation Group, Universidad Nacional Autónoma de México, University of Arizona, University of Colorado Boulder, University of Oxford, University of Portsmouth, University of Utah, University of Virginia, University of Washington, University of Wisconsin, Vanderbilt University, and Yale University.
2020-17340 | INT/EXT | Newsroom