Graphing Solar Energy with Python
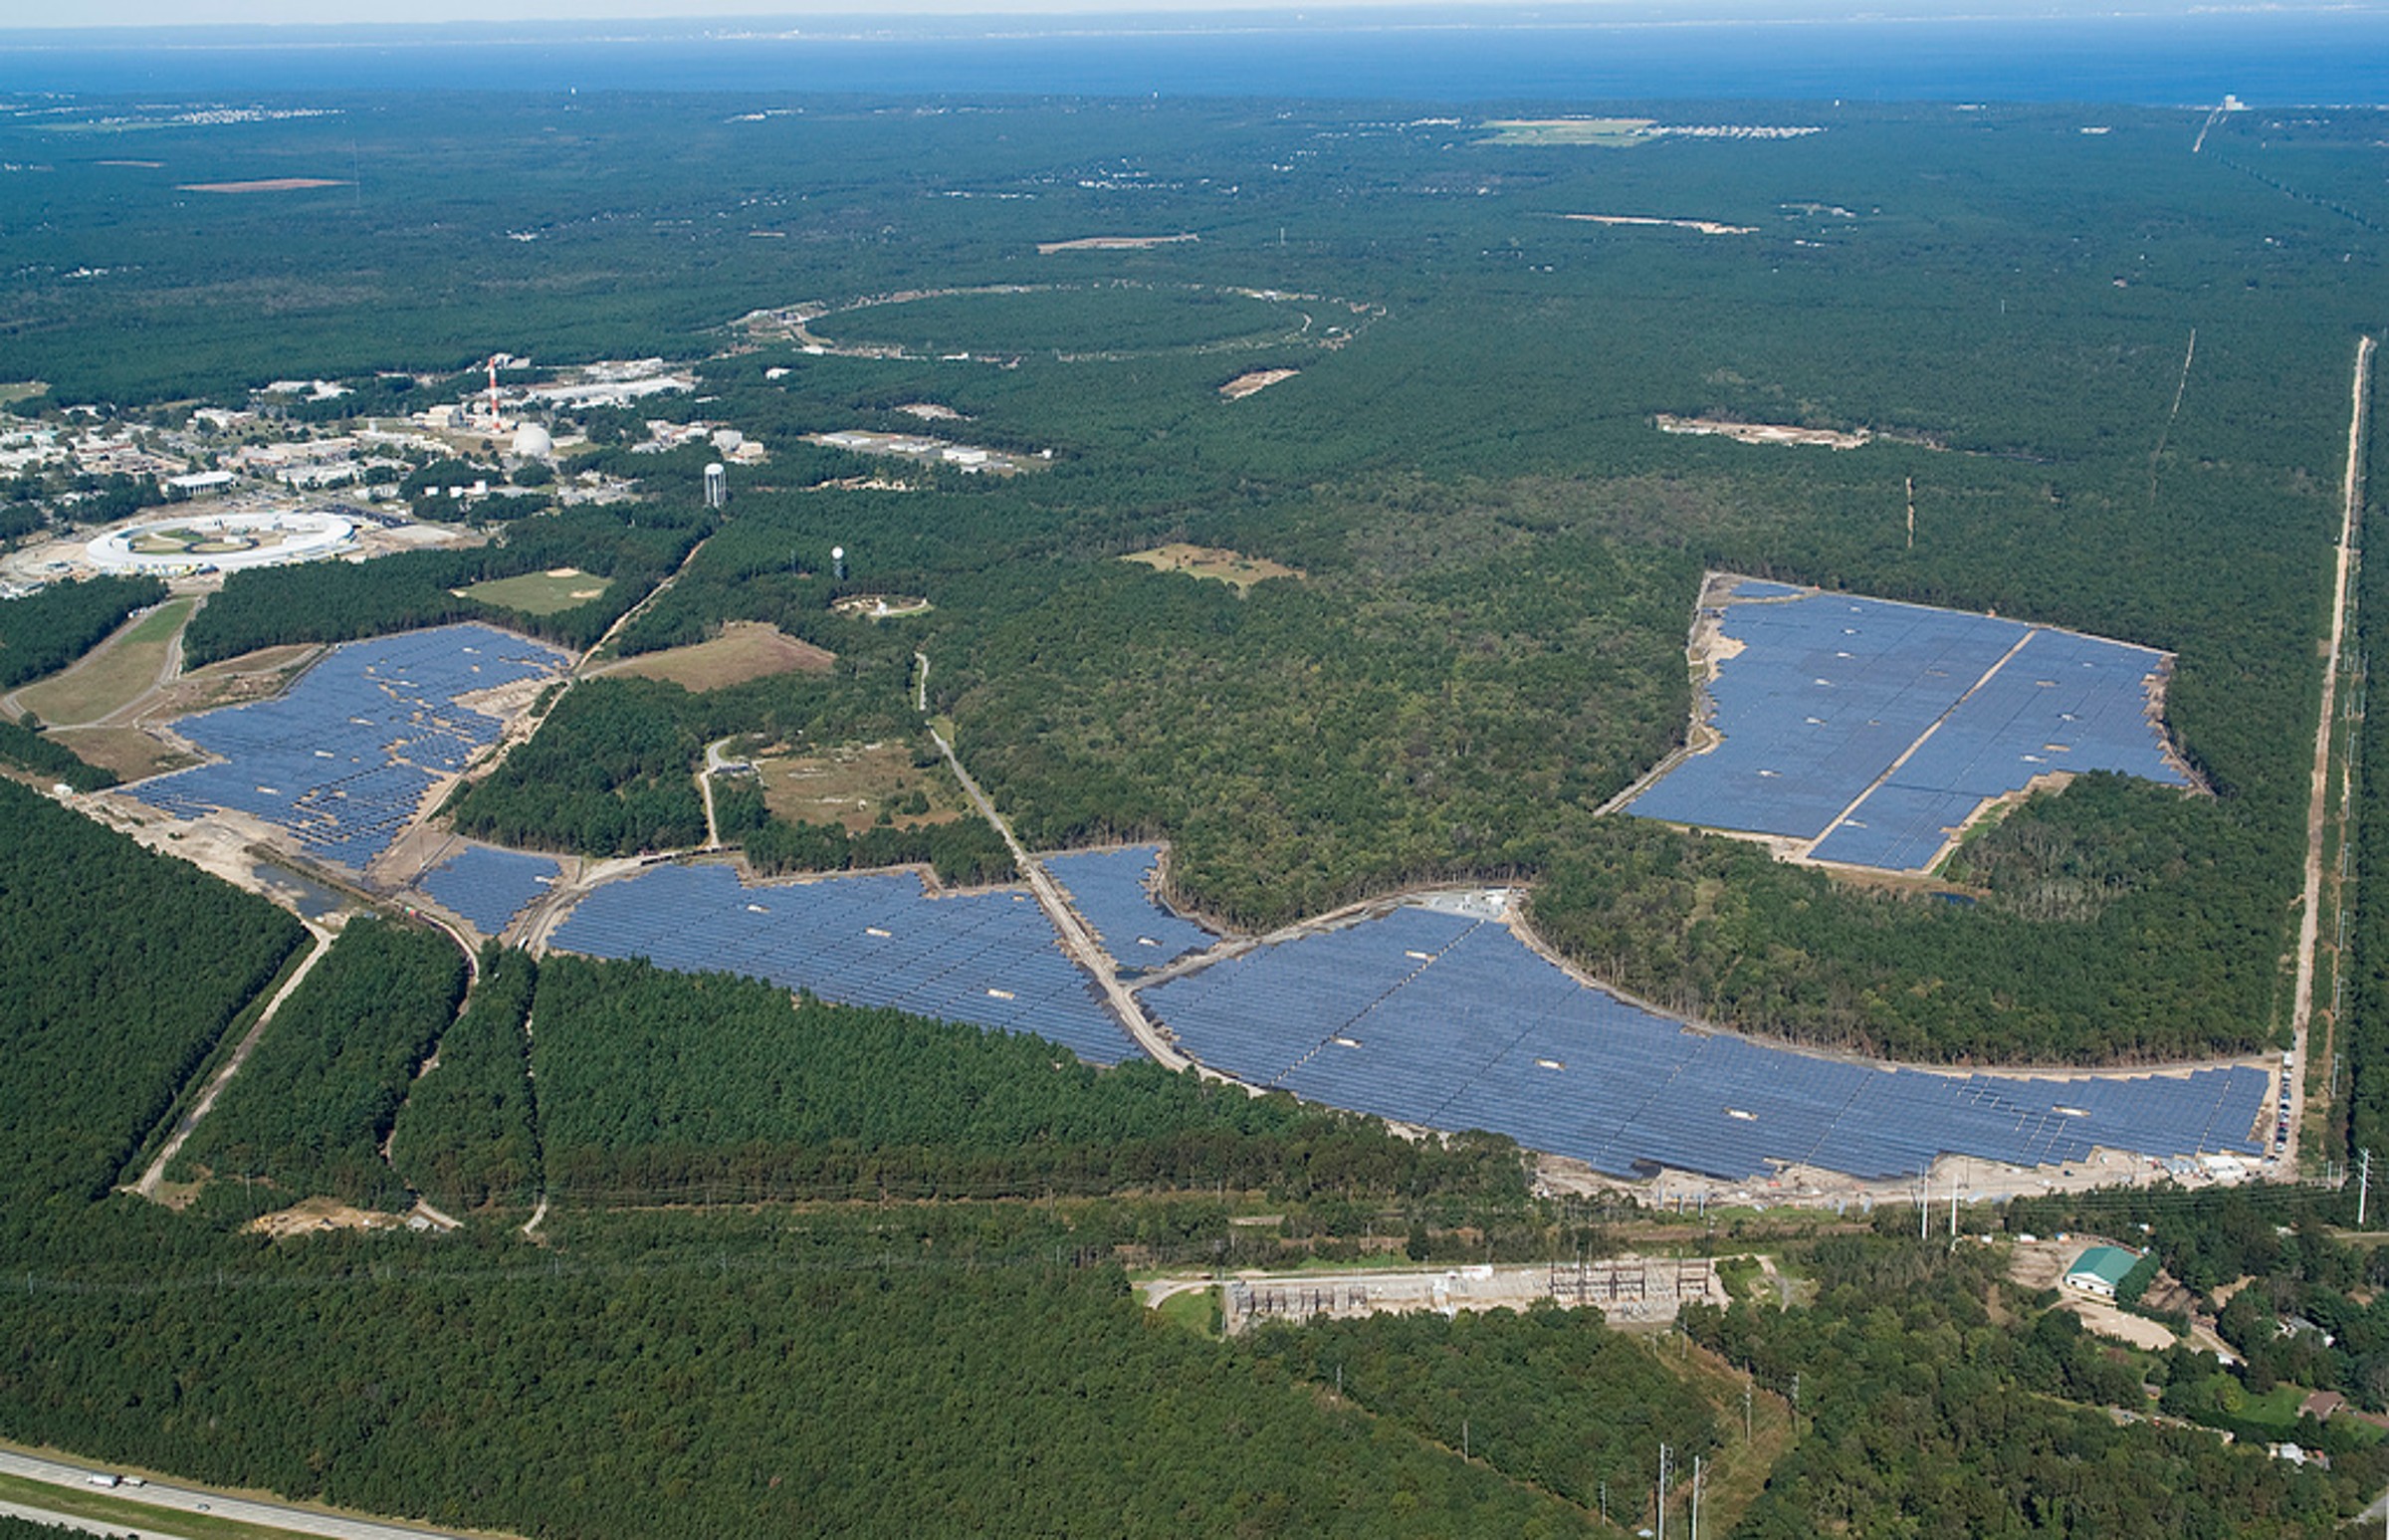
At Brookhaven National Lab’s Northeast Solar Energy Research Center (NSERC), scientists measure and analyze how much sunlight reaches solar panels to optimize power generation. In this session, students will step into the role of data scientists and learn how to use Python, a programming language, to visualize large sets of solar irradiance data and understand a key metric in real-world solar research.
Vocabulary: insolation, irradiance, latitude, linear graph, photovoltaic, pyranometers
| Session Information |
|---|
|
To request field trip dates, visit https://oepreg.bnl.gov/.
To explore programs listed in the ESBOCES Exploratory Enrichment catalog and to submit a BOCES contract request, please visit BOCES EE – Brookhaven Lab
Click here to download a teacher guide for this program.
Click here to download a sneak peak of this program for your students. We highly recommend providing this one-page preview to your students before attending your field trip.
NYS Learning Standards
New York State Science Learning Standards
| Disciplinary Core Ideas | Crosscutting Concepts | Science and Engineering Practices |
|---|---|---|
|
ESS1.B: Earth and the Solar System ESS2.B: Earth's Materials and Systems |
Patterns Stability and Change |
Analyzing and Interpreting Data Using Mathematics and Computational Thinking |
Next Generation English Language Arts Learning Standards
| Speaking and Listening | Language |
|---|---|
|
Comprehension and Collaboration |
Vocabulary Acquisition and Use |
Next Generation Mathematics Learning Standards
|
MP2: Reason abstractly and quantitatively MP4: Model with mathematics Statistics and Probability: Summarize and describe distributions Functions: Define, evaluate, and compare functions |
Contact
-
Ashley Blydenburgh
(631) 344-4495
Workforce Development and Science Education Office
Brookhaven National Laboratory
Building 438
Upton, NY 11973-5000