These Little Lights of Mine
14,000 quasars shine a light on the distant universe
May 1, 2011
The following news release is being issued by the Sloan Digital Sky Survey-III (SDSS-III) collaboration, which operates one of the world's largest digital cameras. Scientists at the U.S. Department of Energy's Brookhaven National Laboratory work on one of four SDSS-III projects, called the Baryon Oscillation Spectroscopic Survey (BOSS).
ANAHEIM — Scientists from the Sloan Digital Sky Survey (SDSS-III) have created the largest ever three-dimensional map of the distant universe by using the light of the brightest objects in the cosmos to illuminate ghostly clouds of intergalactic hydrogen. The map provides an unprecedented view of what the universe looked like 11 billion years ago.
 enlarge
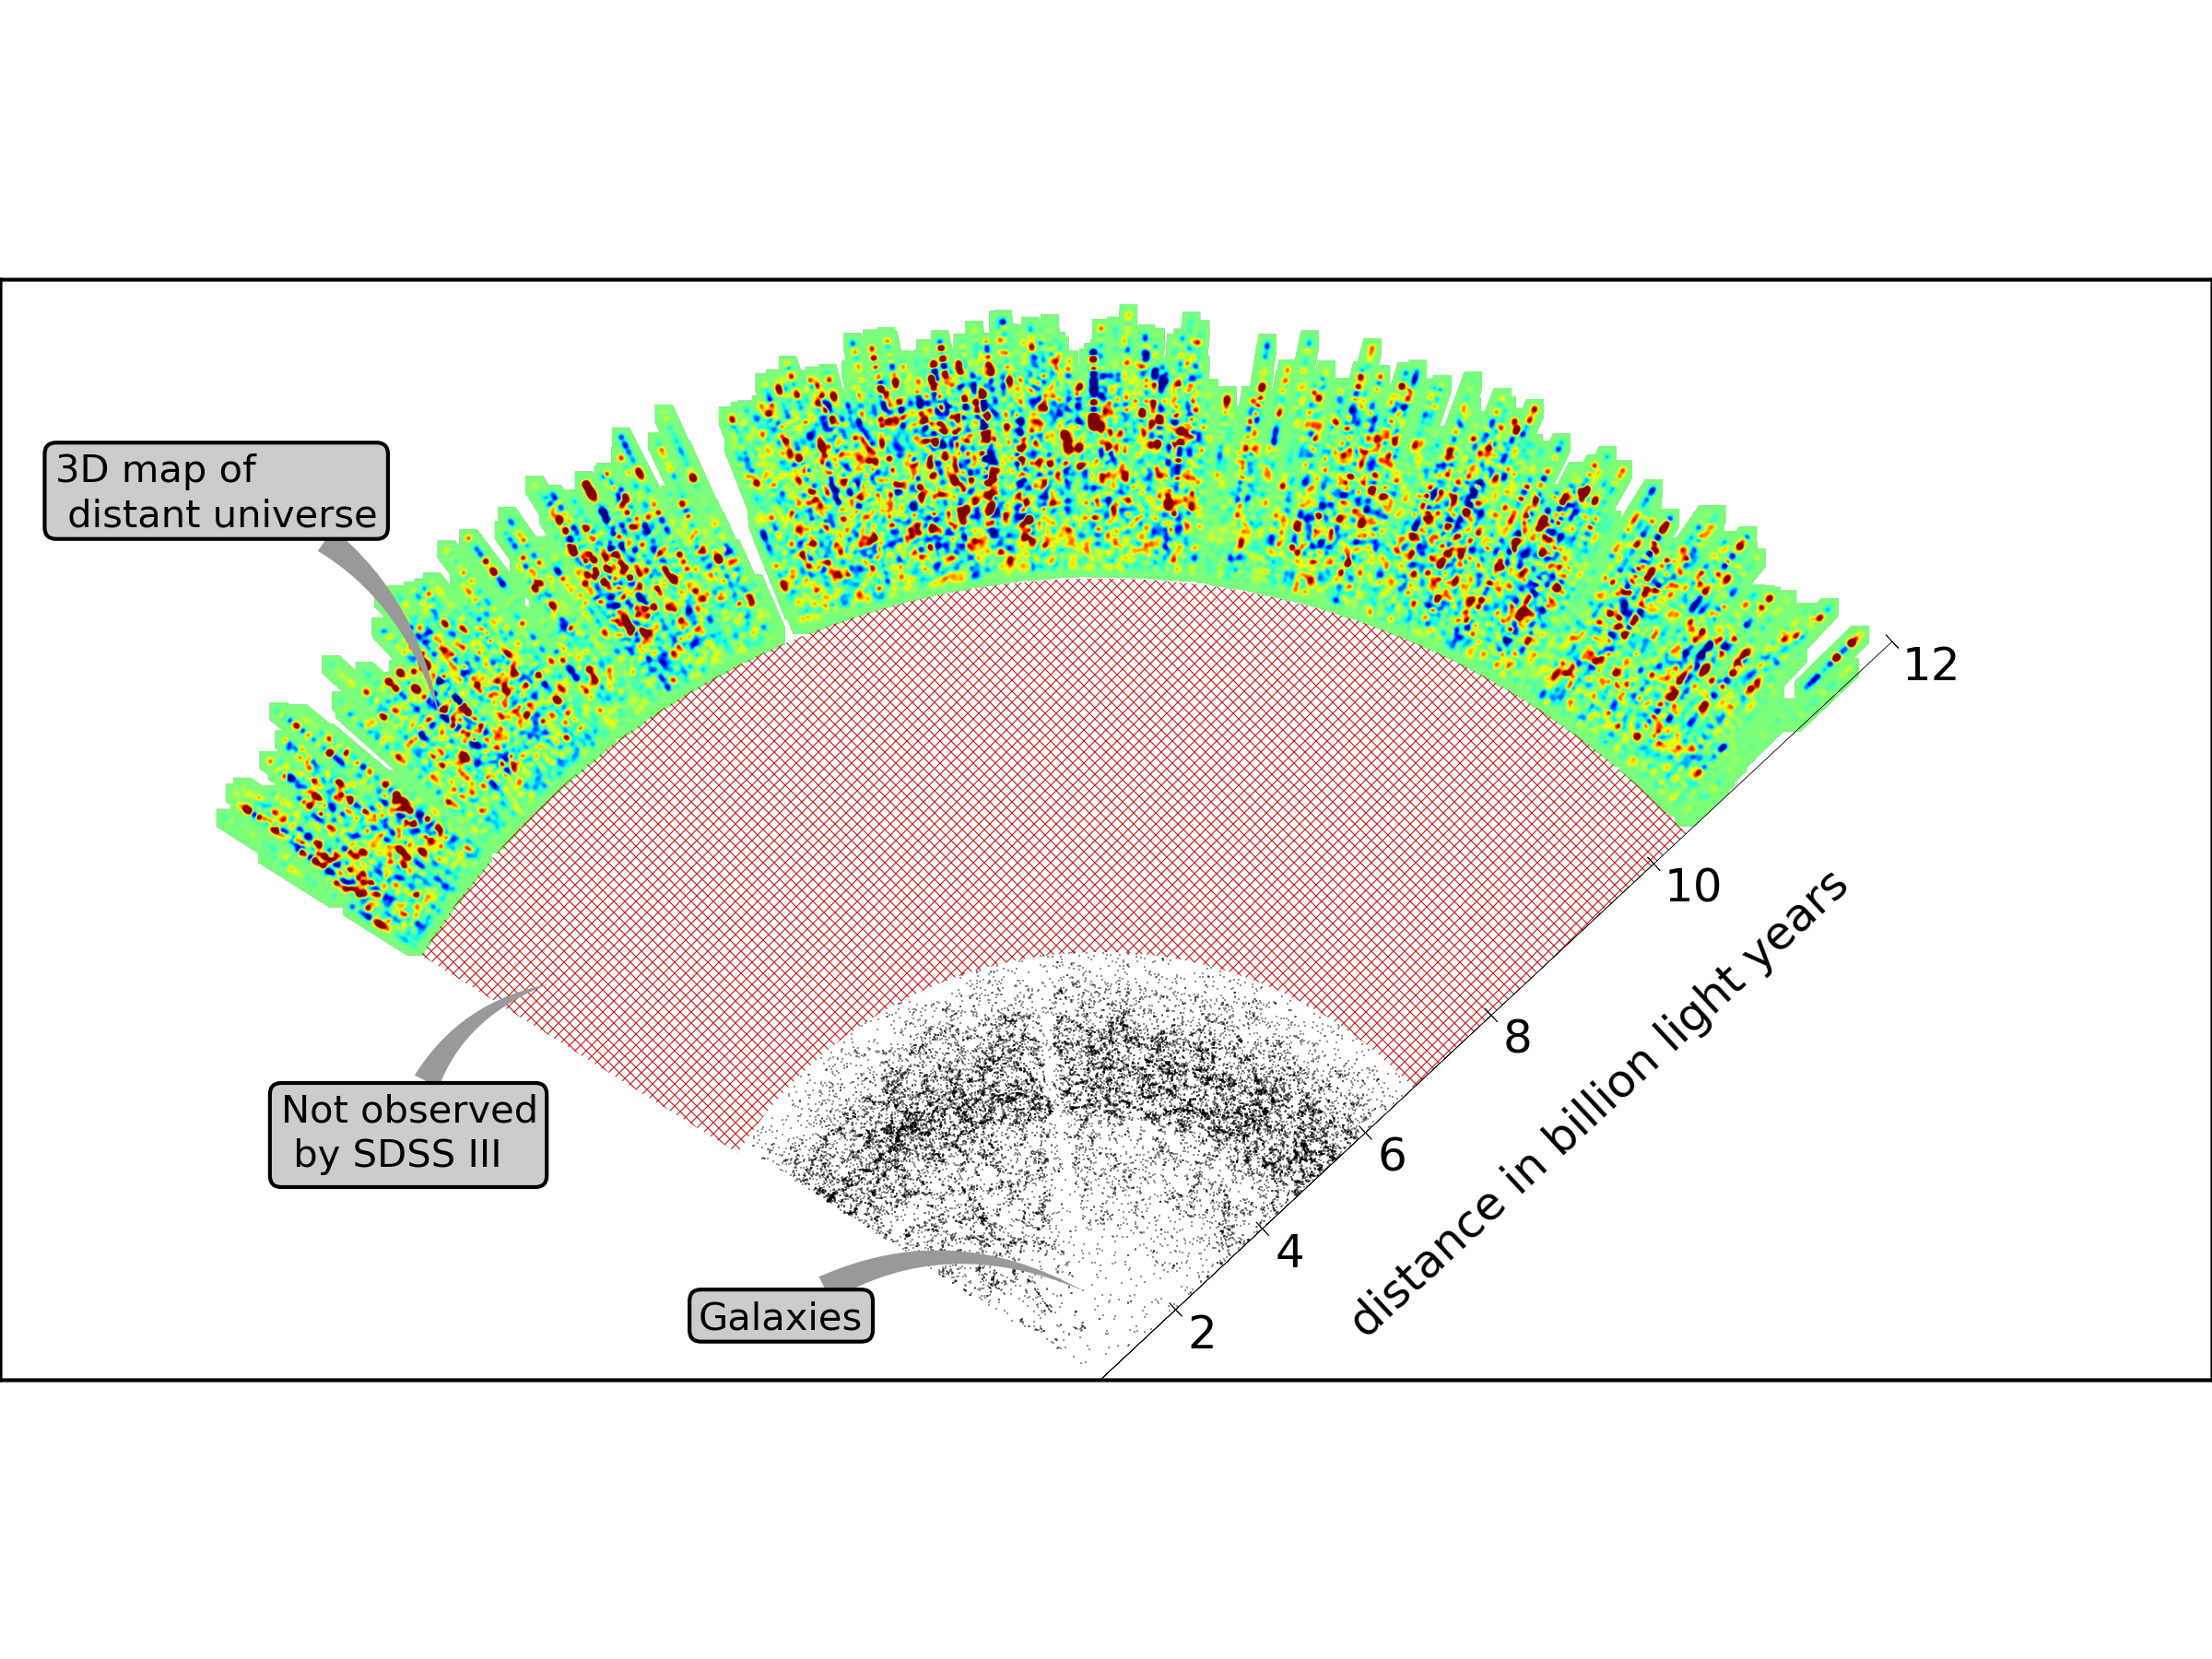
A slice through the three-dimensional map of the universe. We are looking out from the Milky Way, at the bottom tip of the wedge. Distances are labeled on the right in billions of light-years, and each section of the map is labeled on the left. The black dots going out to about 7 billion light years are nearby galaxies. The red cross-hatched region could not be observed with the SDSS telescope, but the future BigBOSS survey could observe it. The colored region shows the map of intergalactic hydrogen gas in the distant universe. Red areas have more gas; blue areas have less gas. This figure is a slice through the full three-dimensional map. Image credit: A. Slosar and the SDSS-III collaboration.
The new findings were presented today at a meeting of the American Physical Society by Anže Slosar, a physicist at the U.S. Department of Energy's Brookhaven National Laboratory, and described in an article posted online on the arXiv astrophysics preprint server.
The new technique used by Slosar and his colleagues turns the standard approach of astronomy on its head. "Usually we make our maps of the universe by looking at galaxies, which emit light," Slosar explained. "But here, we are looking at intergalactic hydrogen gas, which blocks light. It's like looking at the moon through clouds — you can see the shapes of the clouds by the moonlight that they block."
 enlarge
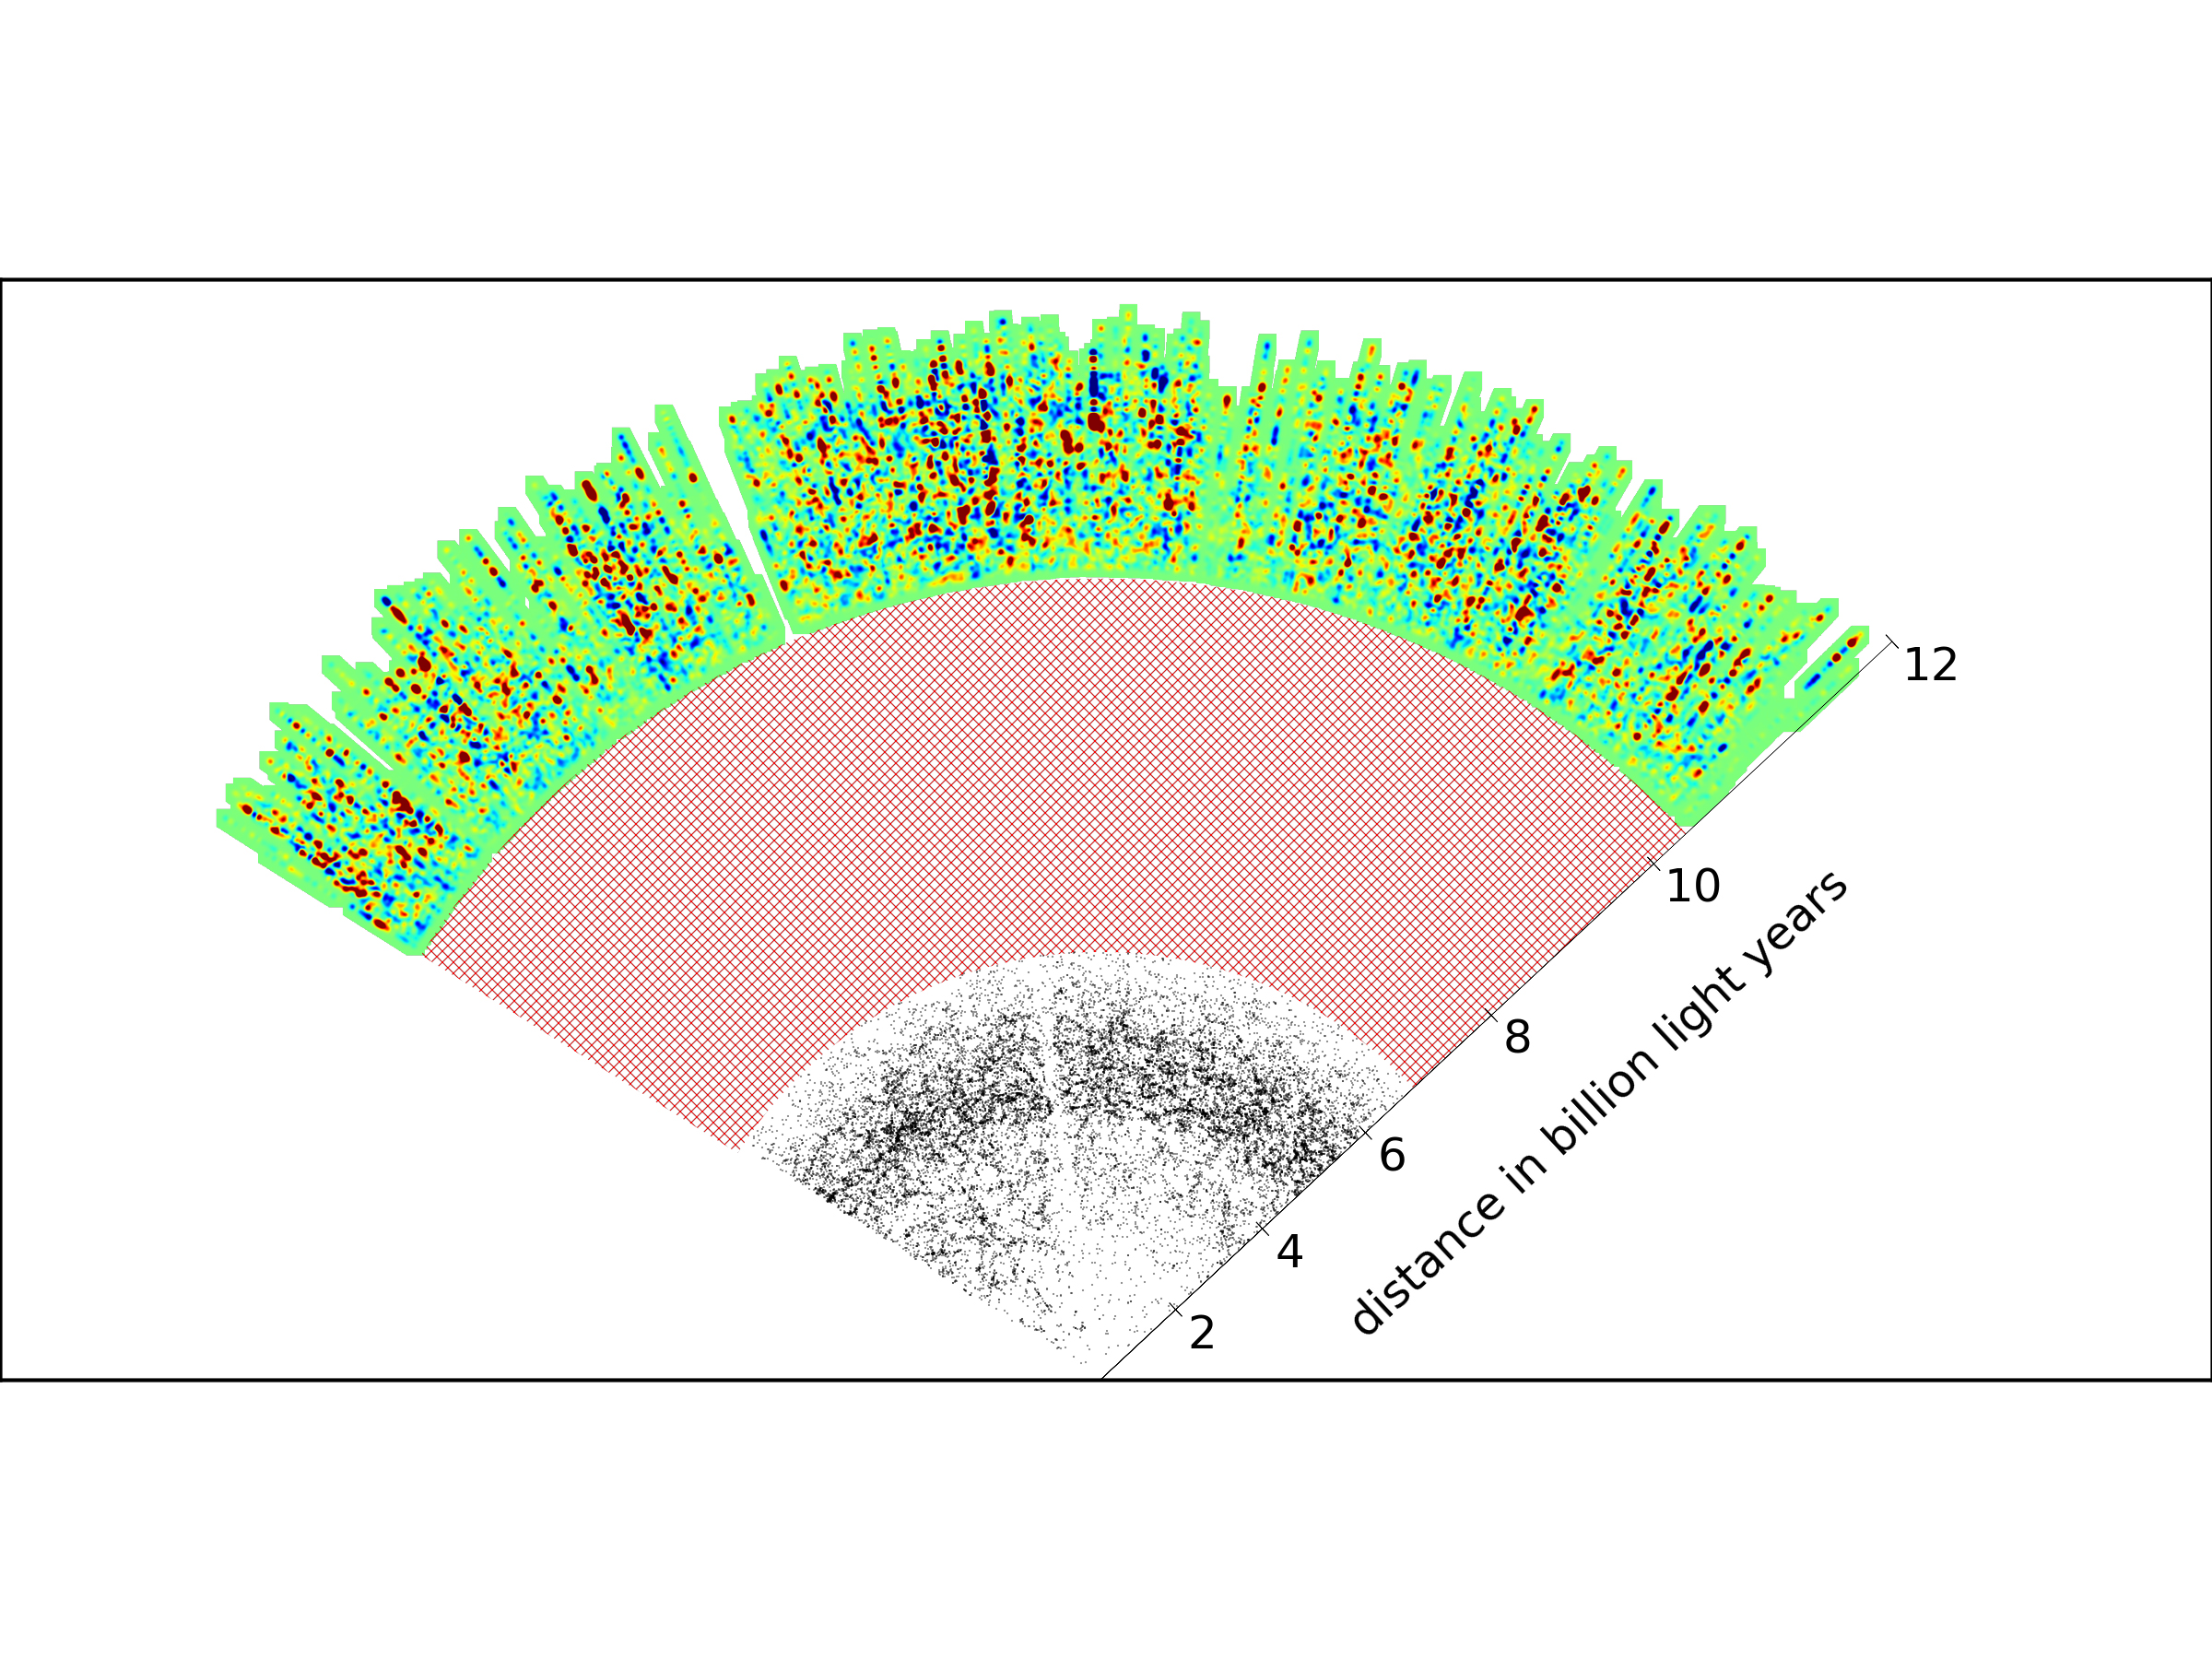
A version of the previous figure without map labels. Image credit: A. Slosar and the SDSS-III collaboration.
Instead of the moon, the SDSS team observed quasars, brilliantly luminous beacons powered by giant black holes. Quasars are bright enough to be seen billions of light years from Earth, but at these distances they look like tiny, faint points of light. As light from a quasar travels on its long journey to Earth, it passes through clouds of intergalactic hydrogen gas that absorb light at specific wavelengths, which depend on the distances to the clouds. This patchy absorption imprints an irregular pattern on the quasar light known as the "Lyman-alpha forest."
An observation of a single quasar gives a map of the hydrogen in the direction of the quasar, Slosar explained. The key to making a full, three-dimensional map is numbers. "When we use moonlight to look at clouds in the atmosphere, we only have one moon. But if we had 14,000 moons all over the sky, we could look at the light blocked by clouds in front of all of them, much like what we can see during the day. You don't just get many small pictures — you get the big picture."
 enlarge
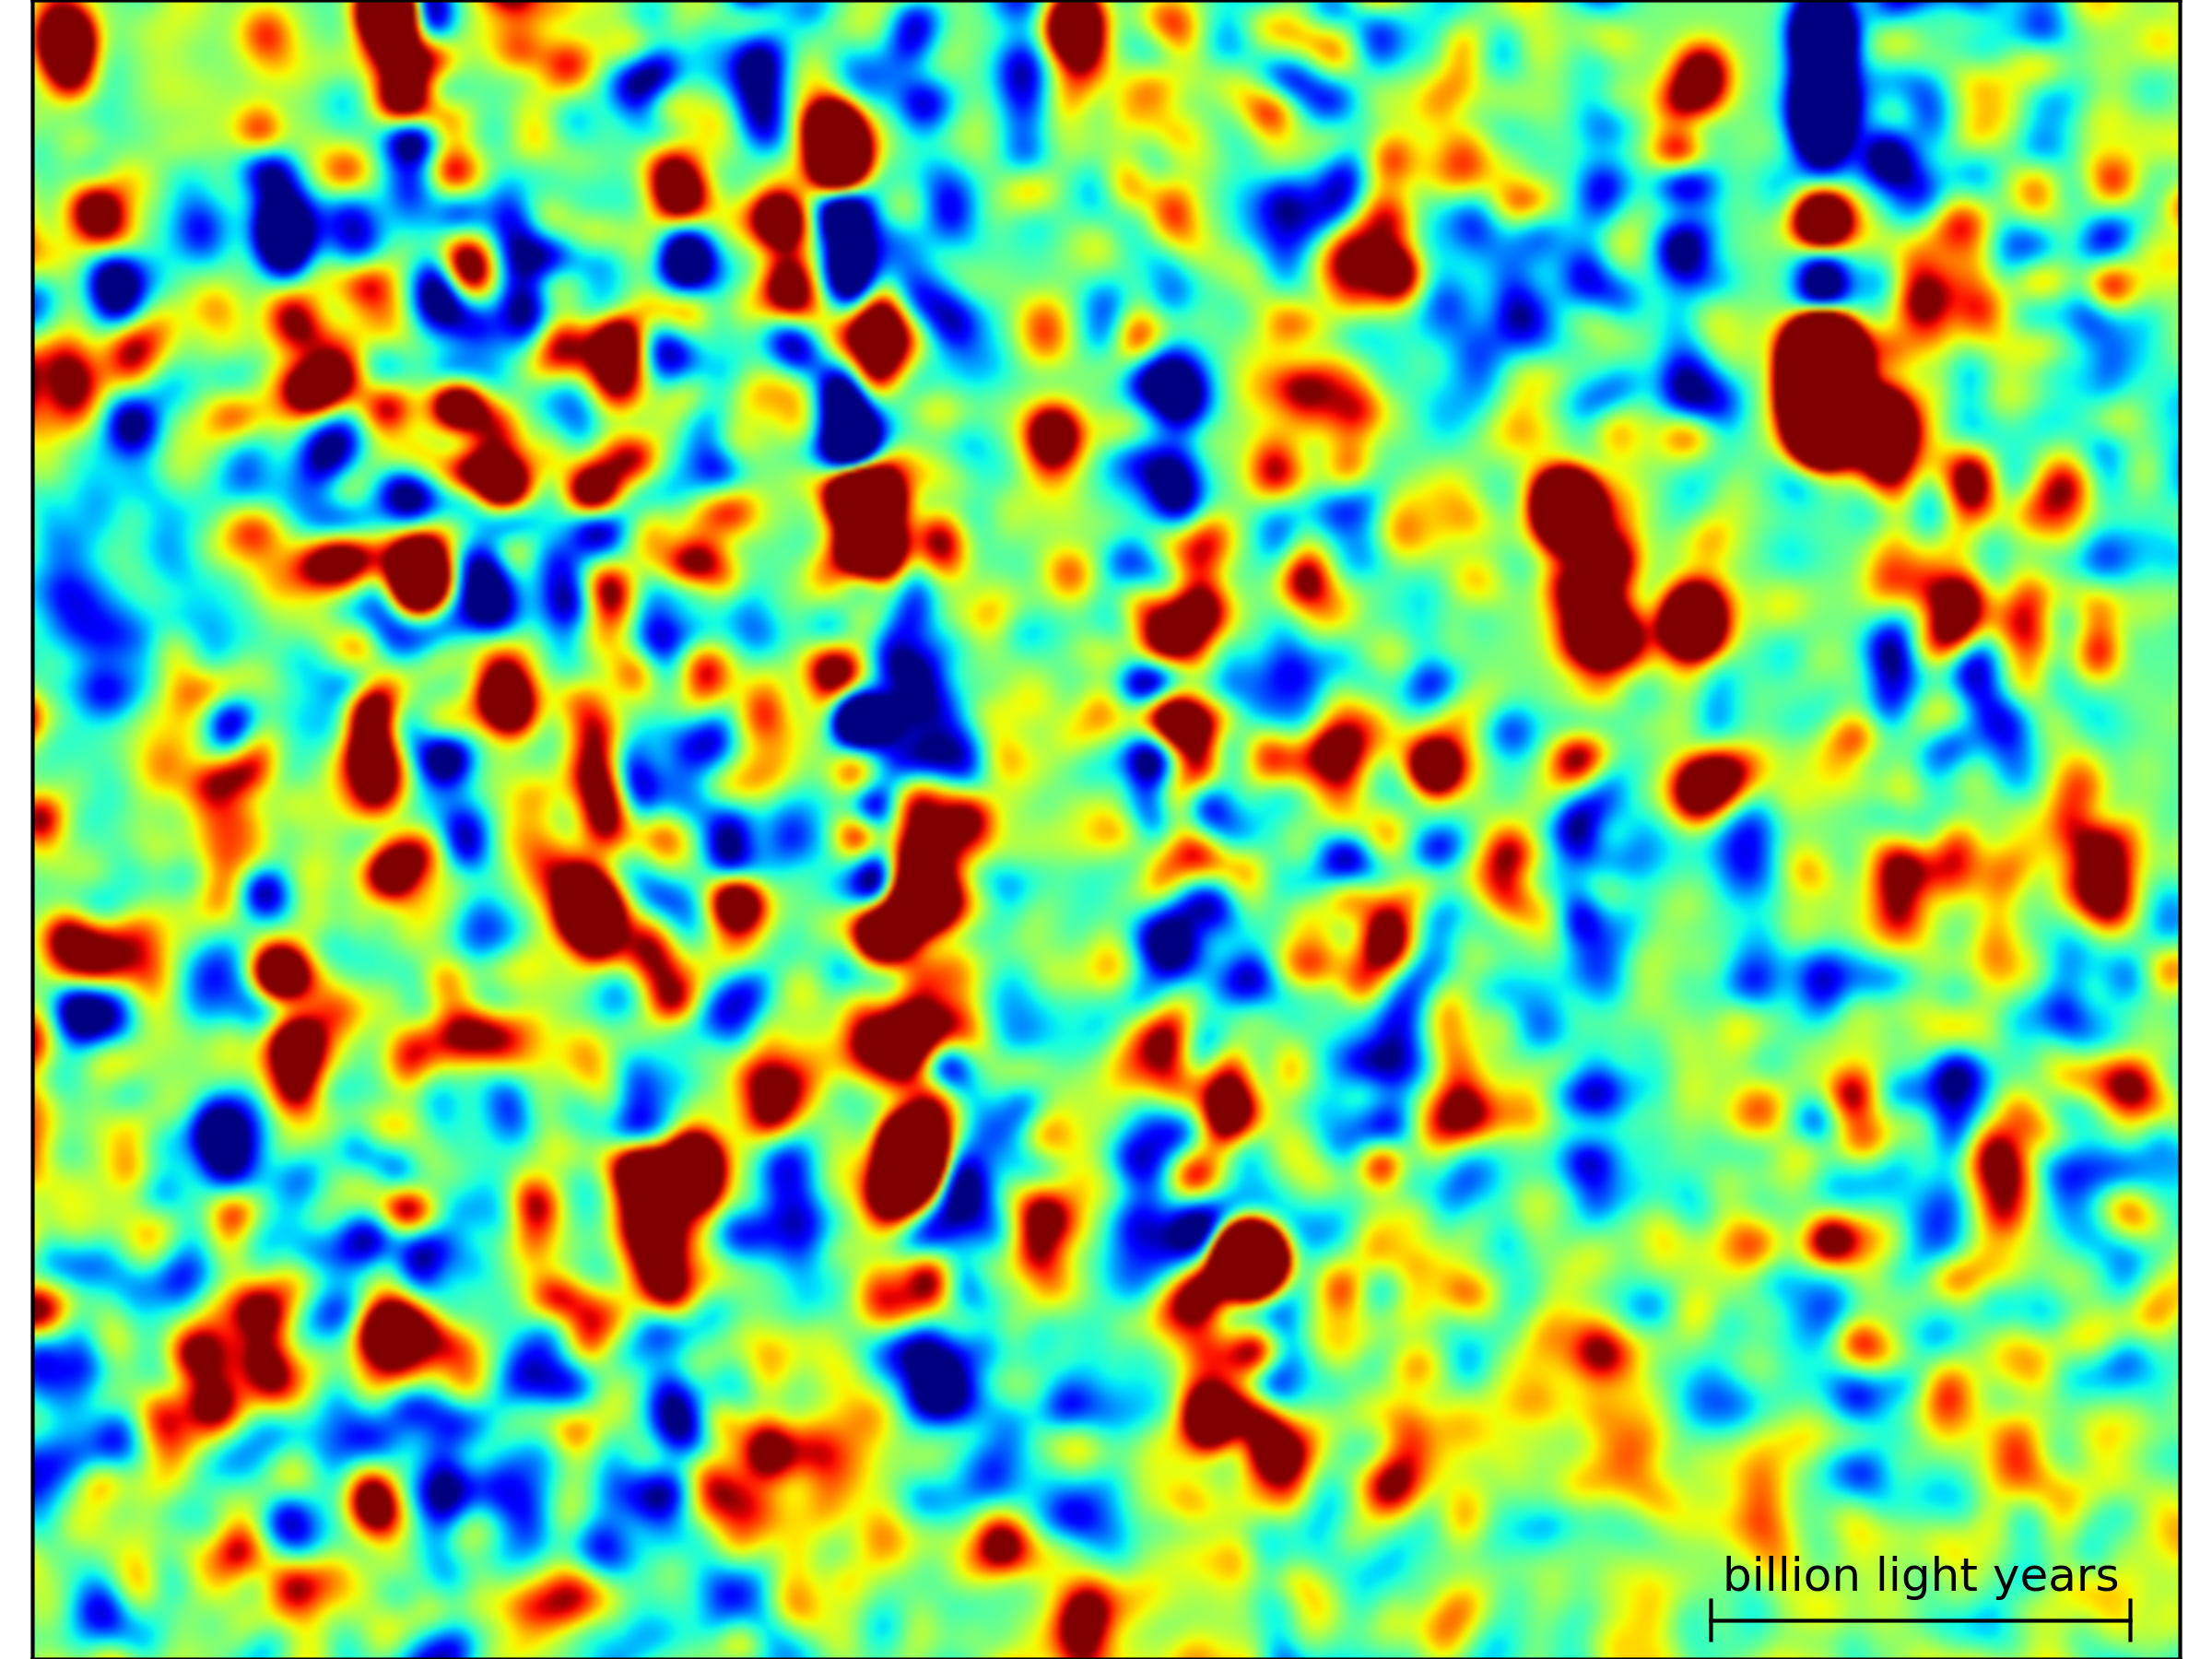
A zoomed-in view of the map slice shown in the previous image. Red areas have more gas; blue areas have less gas. The black scalebar in the bottom right measures one billion light years. Image credit: A. Slosar and the SDSS-III collaboration.
The big picture shown in Slosar's map contains important clues to the history of the universe. The map shows a time 11 billion years ago, when the first galaxies were just starting to come together under the force of gravity to form the first large clusters. As the galaxies moved, the intergalacitc hydrogen moved with them. Andreu Font-Ribera, a graduate student at the Institute of Space Sciences in Barcelona, created computer models of how the gas likely moved as those clusters formed. The results of his computer models matched well with the map. "That tells us that we really do understand what we're measuring," Font-Ribera said. "With that information, we can compare the universe then to the universe now, and learn how things have changed."
The quasar observations come from the Baryon Oscillation Spectroscopic Survey (BOSS), the largest of the four surveys that make up SDSS-III. Eric Aubourg, from the University of Paris, led a team of French astronomers who visually inspected every one of the 14,000 quasars individually. "The final analysis is done by computers," Aubourg said, "but when it comes to spotting problems and finding surprises, there are still things a human can do that a computer can't."
"BOSS is the first time anyone has used the Lyman-alpha forest to measure the three-dimensional structure of the universe," said David Schlegel, a physicist at Lawrence Berkeley National Laboratory in California and the principal investigator of BOSS. "With any new technique, people are nervous about whether you can really pull it off, but now we've shown that we can." In addition to BOSS, Schlegel noted, the new mapping technique can be applied to future, still more ambitious surveys, like its proposed successor BigBOSS.
When BOSS observations are completed in 2014, astronomers can make a map ten times larger than the one being released today, according to Patrick McDonald of Lawrence Berkeley National Laboratory and Brookhaven National Laboratory, who pioneered techniques for measuring the universe with the Lyman-alpha forest and helped design the BOSS quasar survey. BOSS's ultimate goal is to use subtle features in maps like Slosar's to study how the expansion of the universe has changed during its history. "By the time BOSS ends, we will be able to measure how fast the universe was expanding 11 billion years ago with an accuracy of a couple of percent. Considering that no one has ever measured the cosmic expansion rate so far back in time, that's a pretty astonishing prospect."
Quasar expert Patrick Petitjean of the Institut d'Astrophysique de Paris, a key member of Aubourg's quasar-inspecting team, is looking forward to the continuing flood of BOSS data. "Fourteen thousand quasars down, one hundred and forty thousand to go," he said. "If BOSS finds them, we'll be happy to look at them all, one by one. With that much data, we're bound to find things that we never expected."
Acknowledgements
Funding for SDSS-III has been provided by the Alfred P. Sloan Foundation, the Participating Institutions, the National Science Foundation, and the U.S. Department of Energy Office of Science. The SDSS-III web site is http://www.sdss3.org/. SDSS-III is managed by the Astrophysical Research Consortium for the Participating Institutions of the SDSS-III Collaboration including the University of Arizona, the Brazilian Participation Group, Brookhaven National Laboratory, University of Cambridge, University of Florida, the French Participation Group, the German Participation Group, the Instituto de Astrofisica de Canarias, the Michigan State/Notre Dame/JINA Participation Group, Johns Hopkins University, Lawrence Berkeley National Laboratory, Max Planck Institute for Astrophysics, New Mexico State University, New York University, Ohio State University, Pennsylvania State University, University of Portsmouth, Princeton University, the Spanish Participation Group, University of Tokyo, University of Utah, Vanderbilt University, University of Virginia, University of Washington, and Yale University.
SDSS-III is managed by the Astrophysical Research Consortium for the Participating Institutions of the SDSS-III Collaboration including the University of Arizona, the Brazilian Participation Group, Brookhaven National Laboratory, University of Cambridge, University of Florida, the French Participation Group, the German Participation Group, the Instituto de Astrofisica de Canarias, the Michigan State/Notre Dame/JINA Participation Group, Johns Hopkins University, Lawrence Berkeley National Laboratory, Max Planck Institute for Astrophysics, New Mexico State University, New York University, Ohio State University, Pennsylvania State University, University of Portsmouth, Princeton University, the Spanish Participation Group, University of Tokyo, University of Utah, Vanderbilt University, University of Virginia, University of Washington, and Yale University.
"The Lyman-alpha forest in three dimensions: measurements of large scale flux correlations from BOSS 1st-year data," by Anže Slosar, Andreu Font-Ribera, Matthew M. Pieri, James Rich, Jean-Marc Le Goff, Eric Aubourg, John Brinkmann, Nicolas Busca, Bill Carithers, Romain Charlassier, Marina Cortes, Rupert Croft, Kyle S. Dawson, Daniel Eisenstein, Jean-Christophe Hamilton, Shirley Ho, Khee-Gan Lee, Robert Lupton, Patrick McDonald, Bumbarija Medolin, Jordi Miralda-Escudé, Adam D. Myers, Robert C. Nichol, Nathalie Palanque-Delabrouille, Isabelle Paris, Patrick Petitjean, Yodovina Piskur, Emmanuel Rollinde, Nicholas P. Ross, David J. Schlegel, Donald P. Schneider, Erin Sheldon, Benjamin A. Weaver, David H. Weinberg, Christophe Yeche, and Don York is available online at http://arxiv.org/archive/astro-ph.
2011-11270 | INT/EXT | Newsroom