- Home
- Capabilities
- Science Highlights
- Operations
- Publications
-
ES&H
- Experiment Start-up
- Laser Safety
Collider-Accelerator Dept.
- C-AD ES&H Resources
- Staff
- Users' Place
- Apply for Access
Beamline Spectrometry and Masking Techniques
The figures below demonstrate different mask techniques and spectrometer images from different experiments conducted at the ATF.
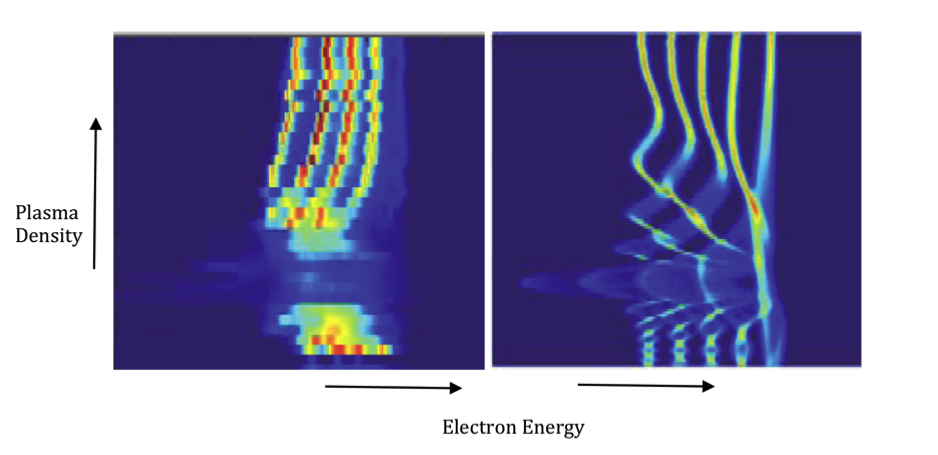
Figure 1. Comparison between the experimental results (left),and simulations (right) for multi-bunch wake-field resonant excitation.
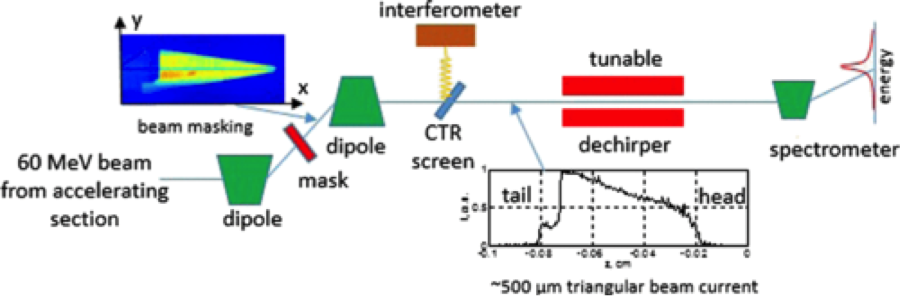
Figure 2. Schematic setup of the DWFA de-chirper experiment. This is a good example of the ATF's masking technique and spectrometer capabilities. [1]
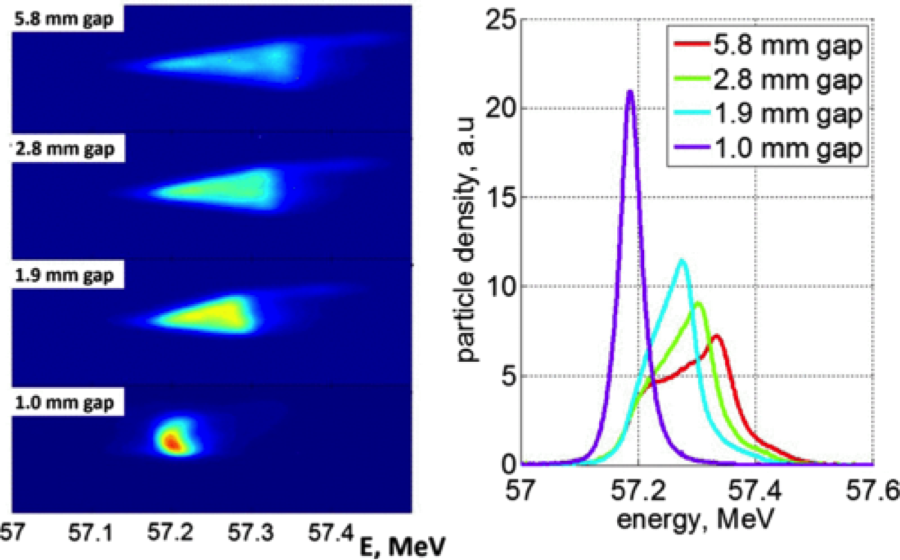
Figure 3. (a) Phosphor screen images of the beam passing through the de-chirper with gap sizes of 5.8, 2.8, 1.9, and 1 mm. (b) The electron energy distribution derived from the images in the left panel. [1]
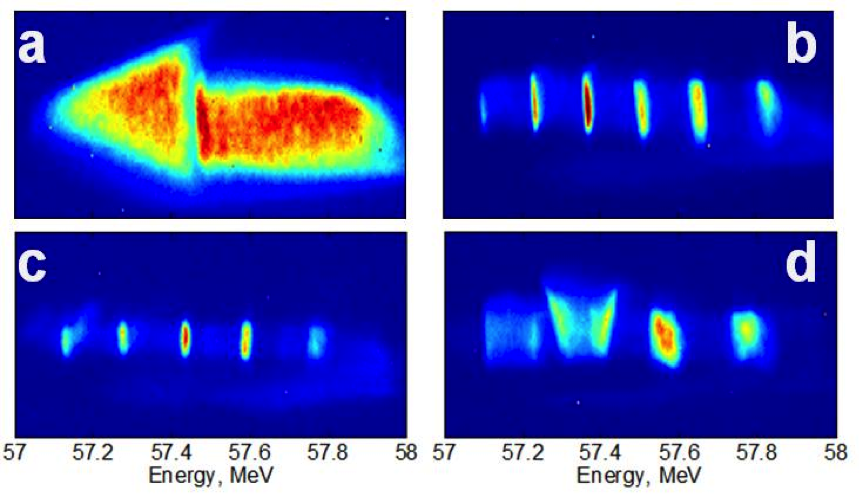
Figure 4. Spectrometer images of the full-size 1.6mm long “arrow” beam (triangle followed by rectangle). a) Original, undisturbed beam; b) beam passing through 0.95 THz structure; c) beam passing through 0.76 THz structure; and, d) beam passing through 0.615 THz structure. [2]
[1] S.Antipov et al., Experimental Demonstration of Energy-Chirp Compensation by a Tunable Dielectric-Based Structure. Phys. Rev. Lett. 112, 114801 – Published 18 March 2014
[2] Antipov, S., et al., Experimental Observation of Energy Modulation in Electron Beams Passing through Terahertz Dielectric Wakefield Structures. Phys Rev Lett, 2012. 108(14): p. 144801