Brookhaven's Computational Science Laboratory Accelerates Radar Simulator Code for Cloud Research
Optimization will enable atmospheric scientists to more quickly evaluate how well cloud models simulate processes observed by radar and other sensors and determine if observational systems are capturing accurate views of the atmosphere
September 15, 2017
 enlarge
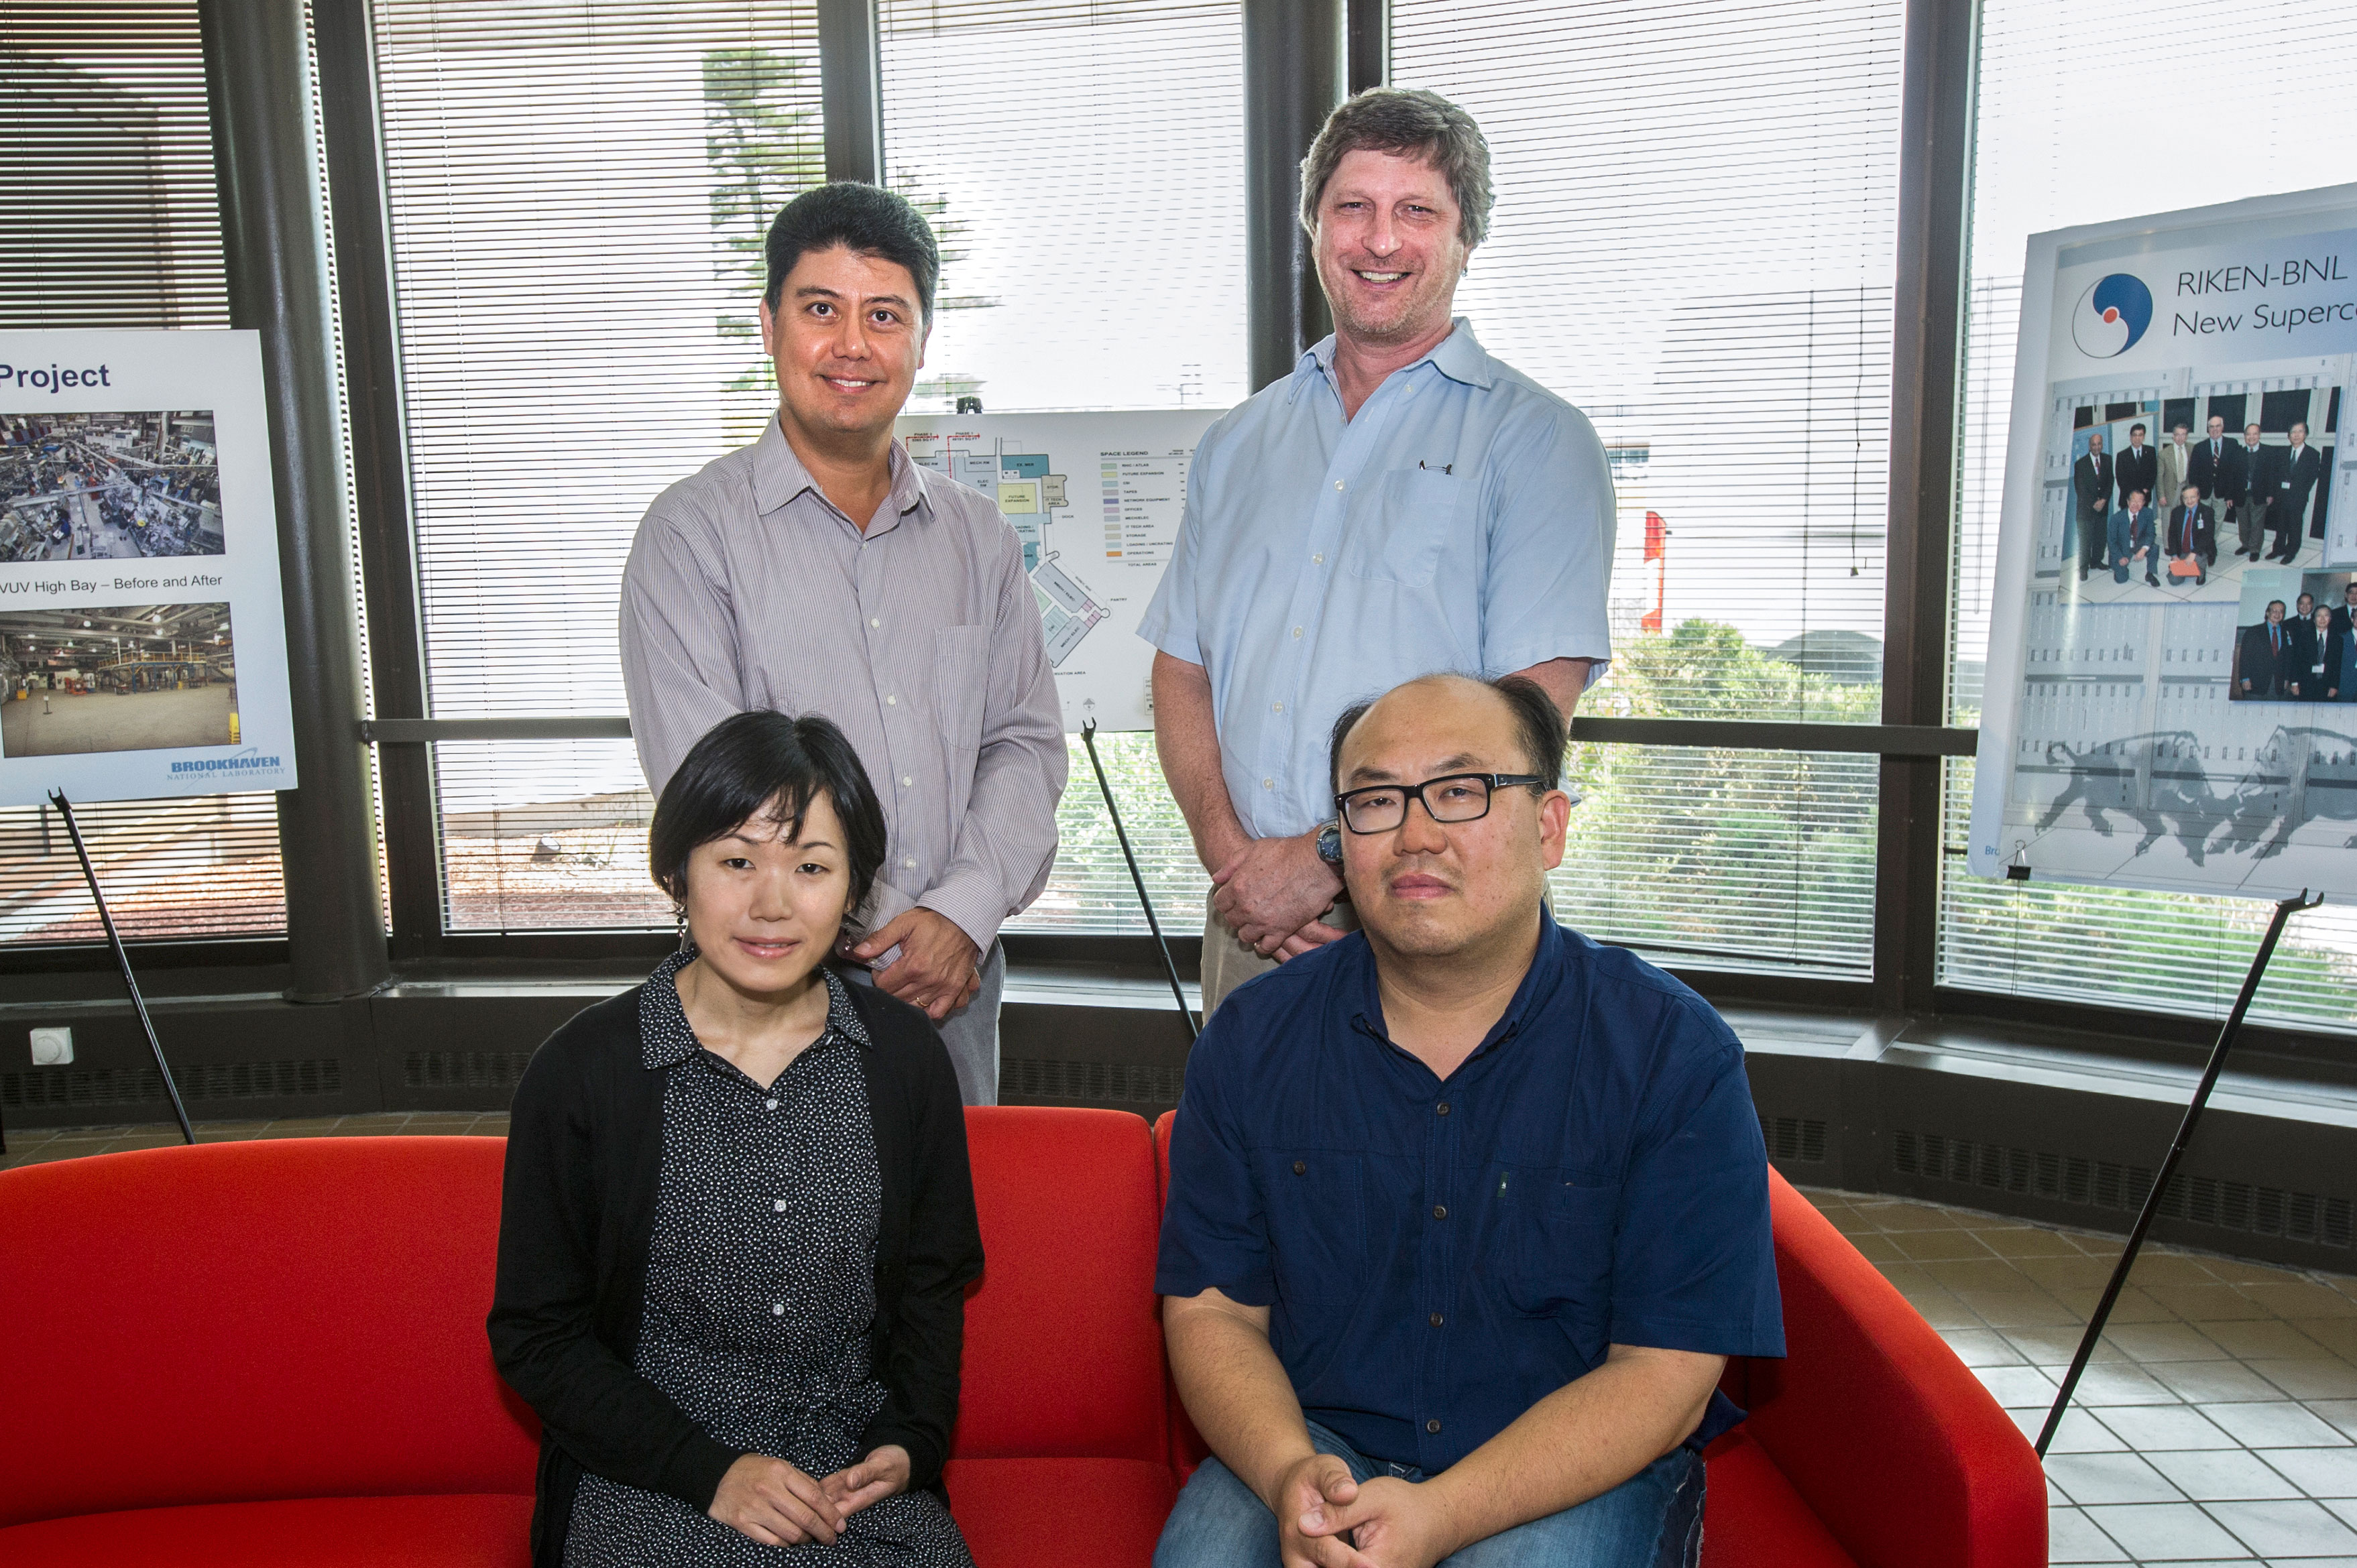
(Standing) Nicholas D'Imperio, Andrew Vogelmann, (seated) Mariko Oue, and Kwangmin Yu at Brookhaven Lab's Computational Science Initiative (CSI). Yu of CSI's Computational Science Laboratory, led by D'Imperio, accelerated the code for the Cloud Resolving Model SIMulator (CR-SIM), which simulates what radar and other sensors would see if incorporated into an atmospheric model that resolves clouds. Pavlos Kollias (not pictured) of Brookhaven's Environmental and Climate Sciences Department and his research group, including Oue, developed CR-SIM. Vogelmann of the same department is using CR-SIM to evaluate model performance.
This analogy highlights two challenges that atmospheric sensors face: sensitivity bias and location bias. The type of sensor used to observe clouds (e.g., radar, lidar), the location of the instrument, and its mode of operation (e.g., pointing direction) can impact cloud measurements. For example, a profiling radar that samples only the atmospheric column that passes over its location will provide a very different answer from a scanning radar that samples a larger area. Simultaneously, the distance of the clouds from the radars determines if the clouds will be detected or not because radar sensitivity decreases with distance.
To assess if observational systems are capturing an accurate or skewed picture of the atmosphere, scientists started creating instrument simulations that can reproduce the technical characteristics of the sensors (e.g., sensitivity, resolution), their interaction with the clouds (e.g., scattering, absorption), and their sampling strategy and placement in space.
Understanding cloud processes
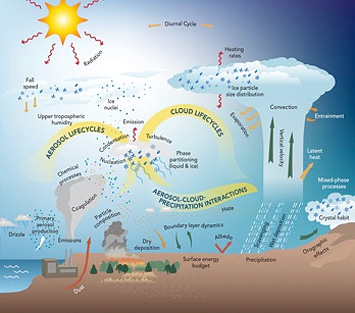
Clouds and aerosols (tiny particles suspended in the atmosphere) influence radiation and precipitation. Credit: DOE Atmospheric System Research.
Combining observation and modeling efforts is the only way to advance this understanding, eventually leading to improved weather forecasts and climate model predictions. However, the combination of observations and models is not straightforward due to sensitivity and sampling bias and other issues.
“Comparing synthetic instrument observations to the real observations helps us determine if we are effectively sampling critical processes such as the convective motions of deep precipitating clouds,” said Pavlos Kollias, who leads DOE’s ASR Radar Science Group. Kollias is also an atmospheric scientist in the Environmental and Climate Sciences Department at DOE’s Brookhaven National Laboratory, a professor at Stony Brook University’s School of Marine and Atmospheric Sciences, and an adjunct professor in McGill University’s Department of Atmospheric and Oceanic Sciences.
Simulating radar observations
A few years ago, Kollias and his research assistant Aleksandra Tatarevic at McGill University developed the initial version of the Cloud Resolving Model Radar SIMulator (CR-SIM), which generates a virtual (synthetic) view of what a radar would see if incorporated into an atmospheric model that resolves clouds.
“Though models can simulate clouds with very high resolution, the problem is how to validate the simulation—how well does it represent reality?” said postdoctoral research associate Mariko Oue of Stony Brook University’s School of Marine and Atmospheric Sciences, who recently updated CR-SIM to be compatible with additional sensors, including lasers that probe the atmosphere. “The CR-SIM software creates virtual observations—that account for all sensor limitations—from virtual clouds, enabling us to fairly compare real observations with model output. In addition, we can use CR-SIM to investigate the optimum setup of our atmospheric observatories in terms of the type, number, and configuration of sensors needed to get a true picture of the atmosphere.”
To create the virtual observations, CR-SIM uses atmospheric variables—such as cloud water content, temperature, humidity, and wind speed—simulated by high-resolution cloud-resolving models (CRM) or large-eddy simulations (LES). These models divide the atmosphere into a three-dimensional computational grid, with each grid cell containing numerical values of the initial atmospheric conditions for a given moment in time. Computer algorithms then solve fundamental physics equations describing how these values change over time. If the size of the grid cells (spatial resolution) is large, these equations have to be simplified, or parameterized, to a certain degree in order to approximate the effects of cloud-relevant processes that cannot be explicitly resolved.
Global climate models, which have grid cells that can be up to hundreds of kilometers on a side, can resolve large-scale atmospheric phenomena caused by circulating air, such as trade winds and jet streams. CRMs, whose grid cells are approximately 10 kilometers, can model thunderstorms and other regional-scale dynamics. With cells as small as 20 meters, LES are capable of modeling small-scale atmospheric motions, including cloud updrafts and downdrafts.
 enlarge
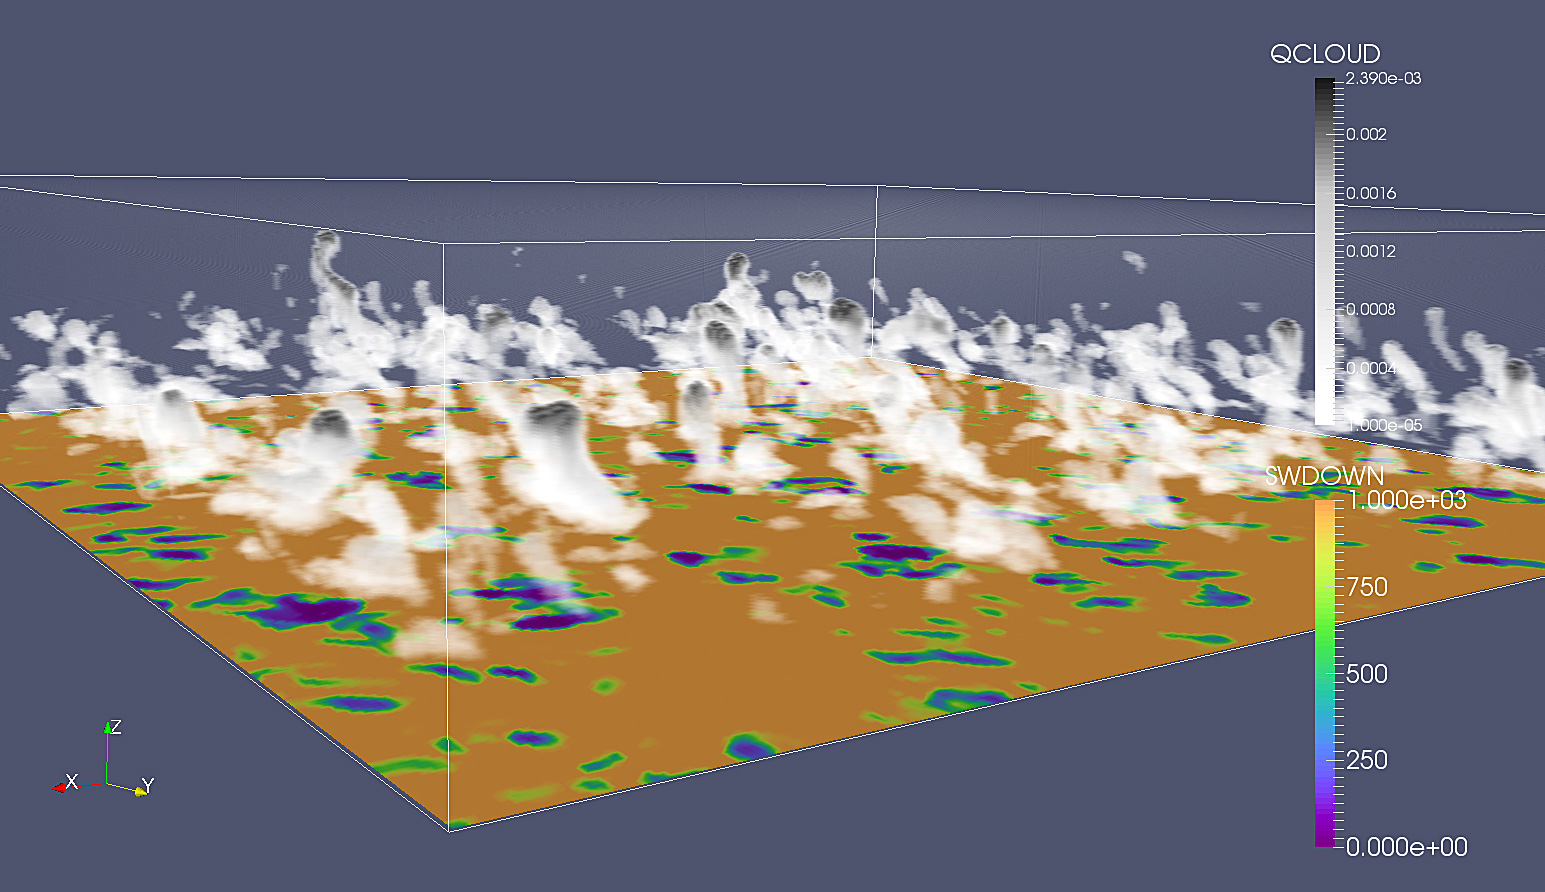
LES is commonly used to simulate clouds and the planetary boundary layer (lowest part of atmosphere). Shown here are the cloud water content (QCLOUD) and the resulting shadows that impact the sunlight reaching the ground. Credit: ARM Climate Research Facility.
The high resolution of LES makes the simulations very computationally intensive, so scientists have typically run them only for idealized conditions. But building up a large database of realistic simulations would provide the statistics needed to improve the accuracy of the parameterizations.
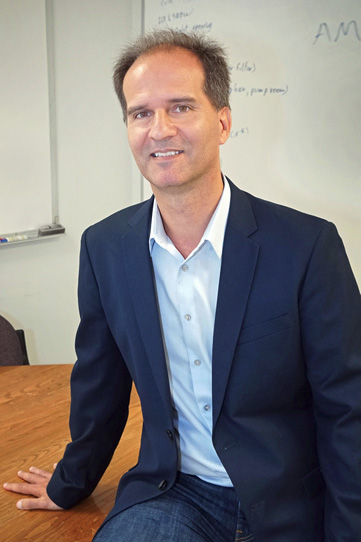
“We are trying to run more realistic LES because they provide detailed information about how clouds form, grow, and produce precipitation,” explained Andrew Vogelmann, an atmospheric scientist in Brookhaven’s Environmental and Climate Sciences Department and technical co-manager of the Cloud Processes Group. Vogelmann is also a co-principal investigator for LASSO (for LES ARM Symbiotic Simulation and Observation), one of four projects in which scientists from Brookhaven Lab and other DOE national labs are using CR-SIM to evaluate model performance and understand observational capabilities.
Improving climate models
The goal of LASSO is to enable routine LES modeling and provide a statistical library of data bundles that combine the simulations with measurements collected at ARM’s fixed atmospheric observatories. These capabilities will help scientists improve the reliability of parameterizations in climate models such as DOE’s Accelerated Climate Modeling for Energy (ACME). Powered by next-generation supercomputers, ACME will provide an ultrahigh-resolution modeling capability for predicting the future global climate.
 enlarge
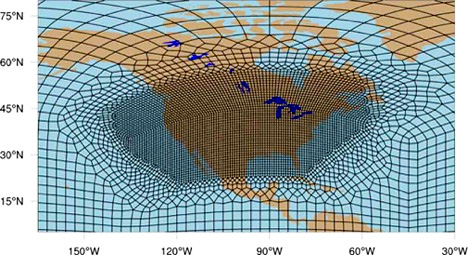
An example of ACME horizontal grid spacing that can be configured to have enhanced resolution over regions of interest via a regional refinement mesh—in this case, centered over the contiguous United States. The mesh improves the model simulations by better resolving important physical processes, such as those involving clouds and precipitation. Credit: DOE Office of Biological and Environmental Research, Climate and Environmental Sciences Division.
“The approach to advancing ACME is to develop an understanding of cloud properties and processes through observations and high-resolution modeling and use that understanding to improve the parameterizations that go into the model,” said Vogelmann.
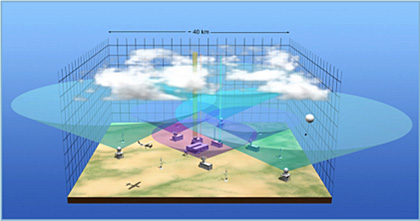
This illustration depicts ARM's Southern Great Plains atmospheric observatory, incorporating a network of instruments to support model development and evaluation. Credit: ARM Climate Research Facility.
For instance, the LASSO project already has 192 LES simulations and will have another 544 for the next data release. “There are a lot of computational grid points for each LES variable, and performing computations at every single one of these points would cause a computational bottleneck,” explained Vogelmann. “It could take 18 hours to compute instrument-equivalent output from the LES variables for one case—about the same amount of time as the LES simulation itself.”
Overcoming the computational bottleneck
According to Nicholas D’Imperio, chair of Brookhaven Lab’s Computational Science Laboratory, the CR-SIM code was running slowly because it was input/output (I/O) bound: “The time it took to complete a computation was largely determined by the time spent receiving and sending data. Input and output are very slow processes in a computer—up to 1000 times slower than processing or memory access.”
To eliminate this bottleneck, Kwangmin Yu, an advanced technology engineer in the Computational Science Laboratory, rewrote the I/O-bound portion of the code and put it into memory.
With this rewrite, Yu increased the code’s speed by 57 times. Using a parallel programming paradigm called OpenMP (for Multi-Processing), he further accelerated the code by a factor of three, for a total speedup of 168 times the original.
“A run that previously took 18 hours now runs in 18 minutes (without parallelization) and 6 minutes (with parallelization),” said Yu, who is also working on automating CR-SIM settings to make the software more easily transferrable to a wide variety of computers.
Extending CR-SIM worldwide
Because of the success achieved by the Computational Science Laboratory, Kollias expects the CR-SIM user community to grow significantly. Colleagues from the Max Planck Institute for Meteorology (MPI-M) in Germany have already expressed interest in using the software with ICON, a modeling system for climate research and weather prediction that is being co-developed by MPI-M and the Germany Weather Service. Other interested countries include Brazil, China, and South Korea.
The ICON project seeks to develop a new generation of climate and weather forecasting models whose grids are derived from icosahedrons (20-sided polyhedrons). This new approach to climate modeling enables grid refinement and provides a common grid infrastructure for atmosphere and ocean models. In this example, the spherical icosahedron (light blue) was globally and regionally refined within three steps: globally (dark blue), on the Northern hemisphere (green), and in a region over Europe (red). Credit: Max Planck Institute for Meteorology.
“Our philosophy is to widely distribute this simulator package to the research community, providing not only software documentation and regular updates but also support personnel who can help users set up the software and continue to interact with them,” said Kollias. “Brookhaven Lab has both the expertise and coding center resources for nurturing such a software package.”
Going forward, Kollias’ team is thinking about ways to make CR-SIM more user-friendly and interactive, such as through graphical user interfaces and other visualization tools. There is also the possibility of further accelerating the simulator code to support real-time computations within the models.
In the meantime, CR-SIM will begin to support activities of Brookhaven’s new Center for Multiscale Applied Sensing, which Kollias directs. At this center, scientists will develop systems for observing and predicting weather and environmental conditions around energy hot spots, including urban and coastal locations and renewable energy facilities.
The ARM Climate Research Facility is a DOE Office of Science User Facility.
Brookhaven National Laboratory is supported by the Office of Science of the U.S. Department of Energy. The Office of Science is the single largest supporter of basic research in the physical sciences in the United States, and is working to address some of the most pressing challenges of our time. For more information, please visit science.energy.gov.
Follow @BrookhavenLab on Twitter or find us on Facebook.
2017-12300 | INT/EXT | Newsroom