CFN Staff Spotlight: Xiaohui Qu Bridges the Data Science-Materials Science Gap
interview with a CFN staff member
January 15, 2020
 enlarge
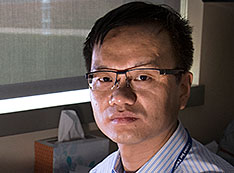
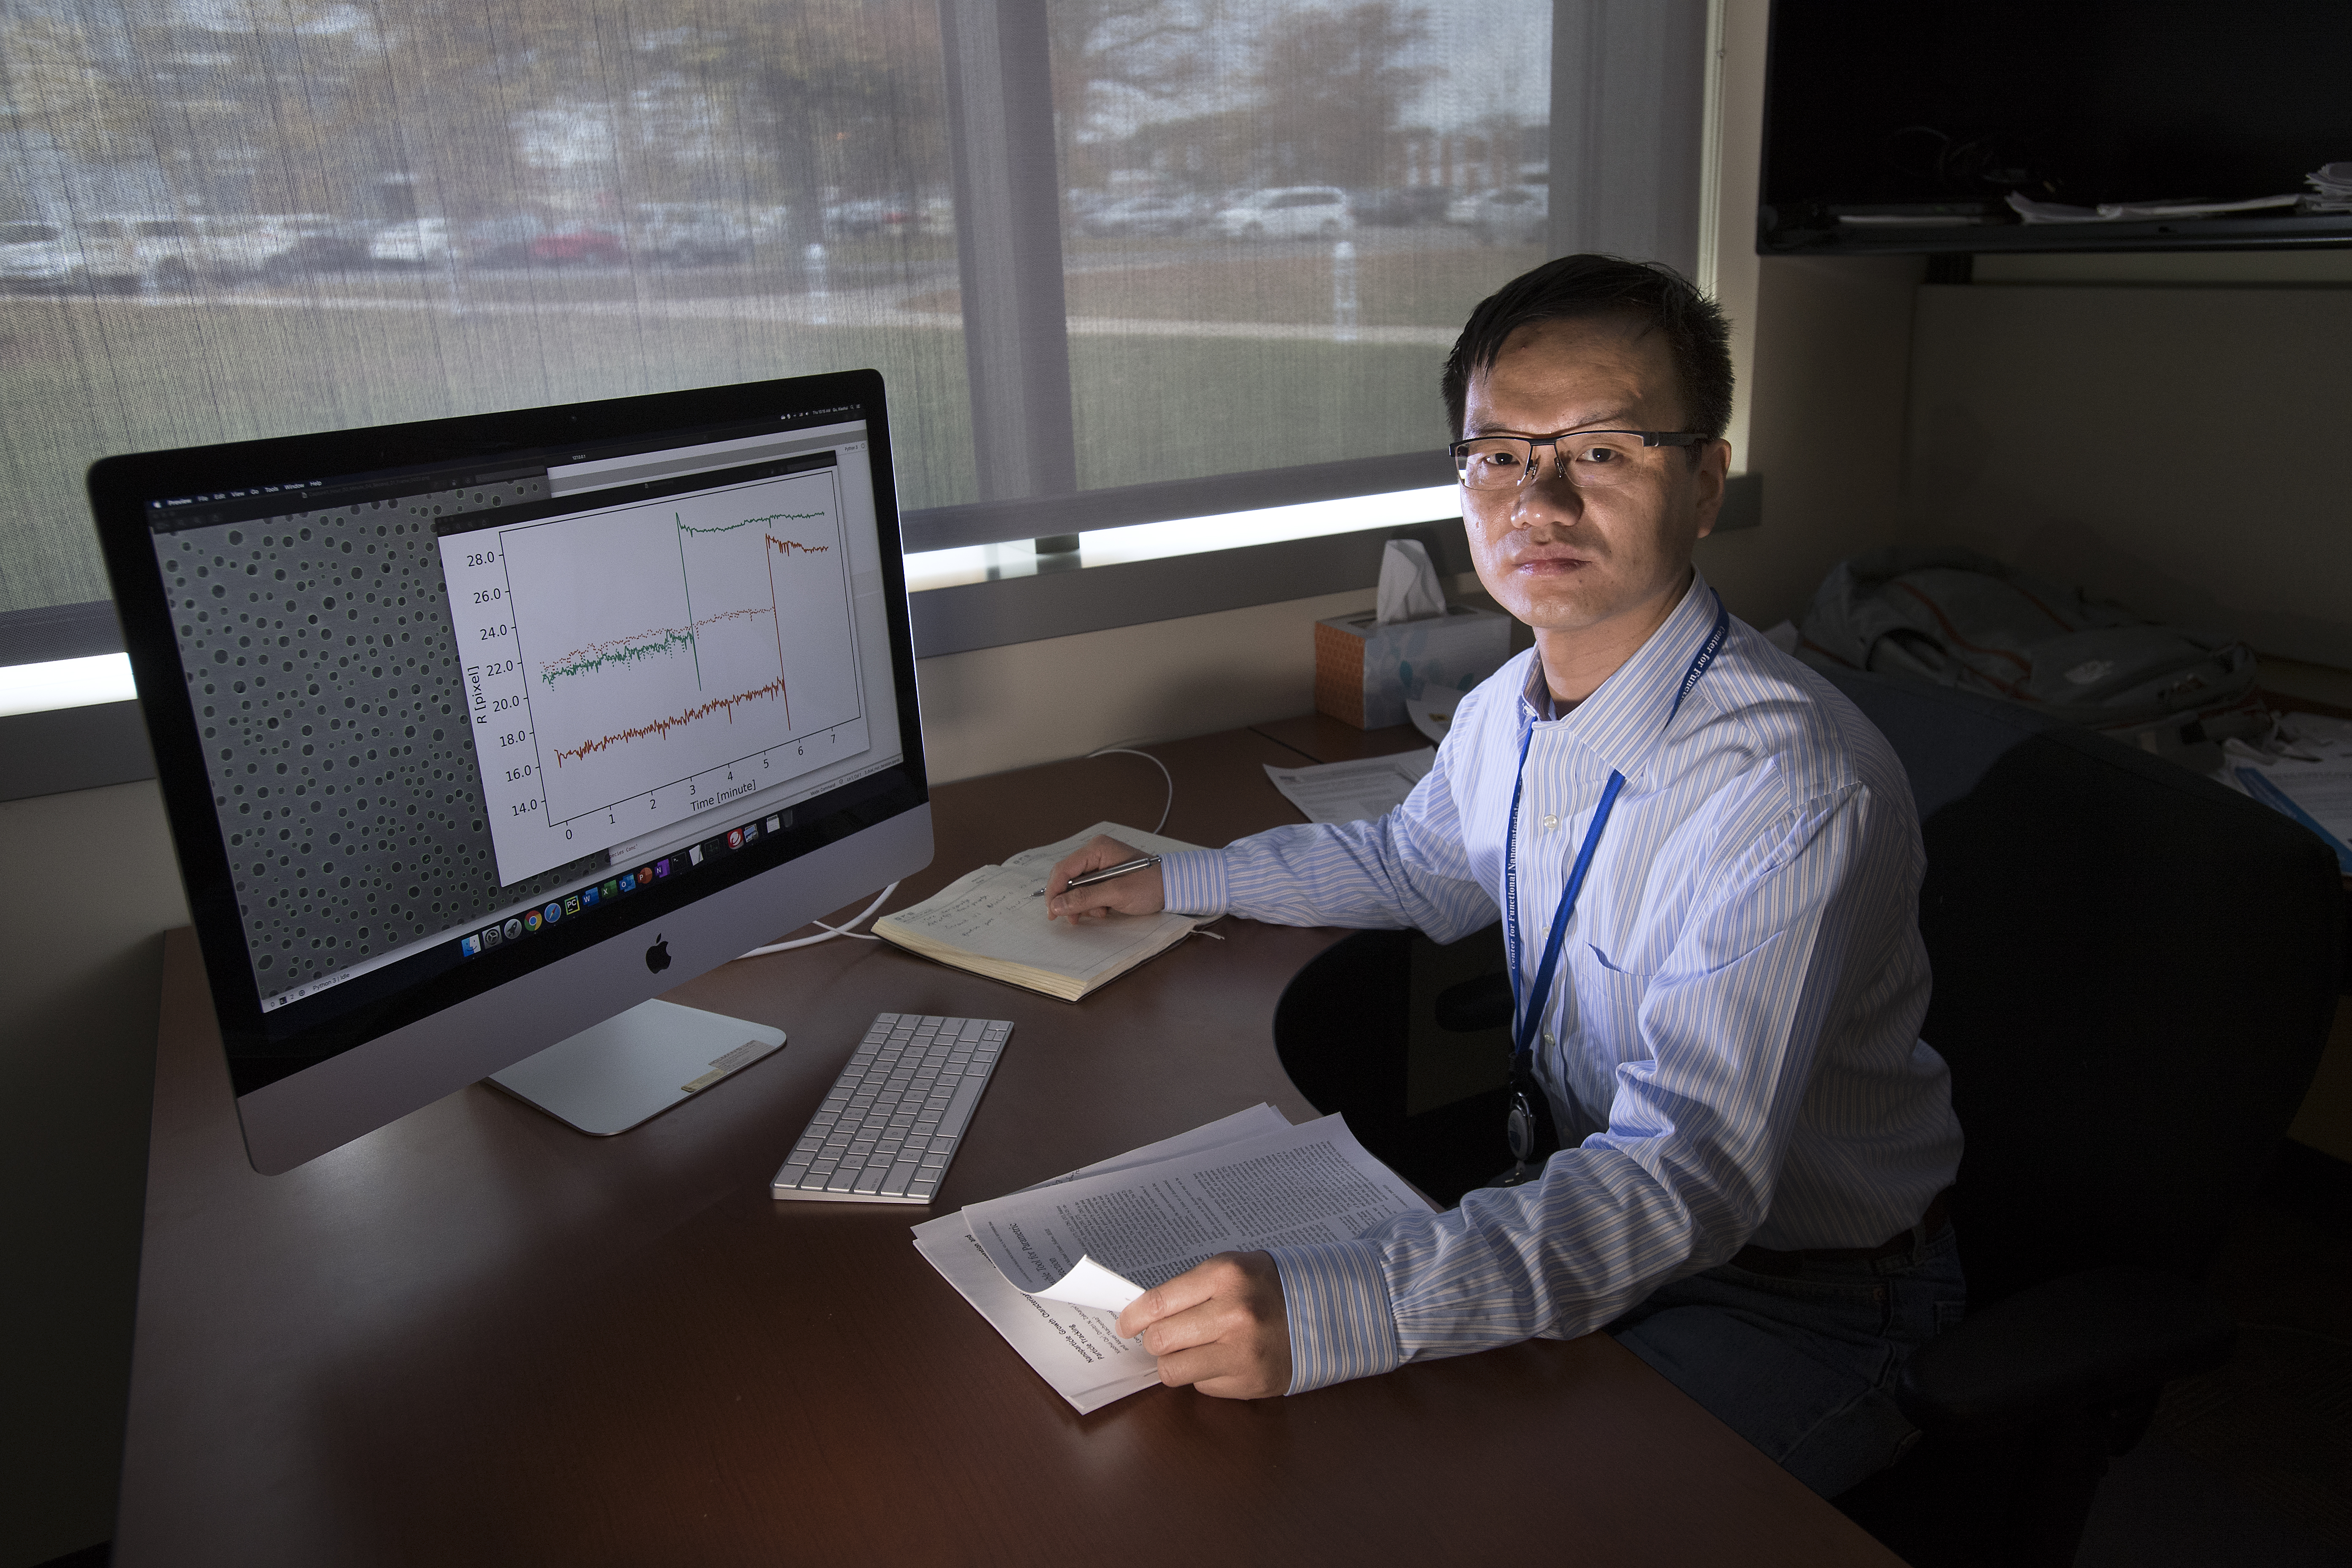
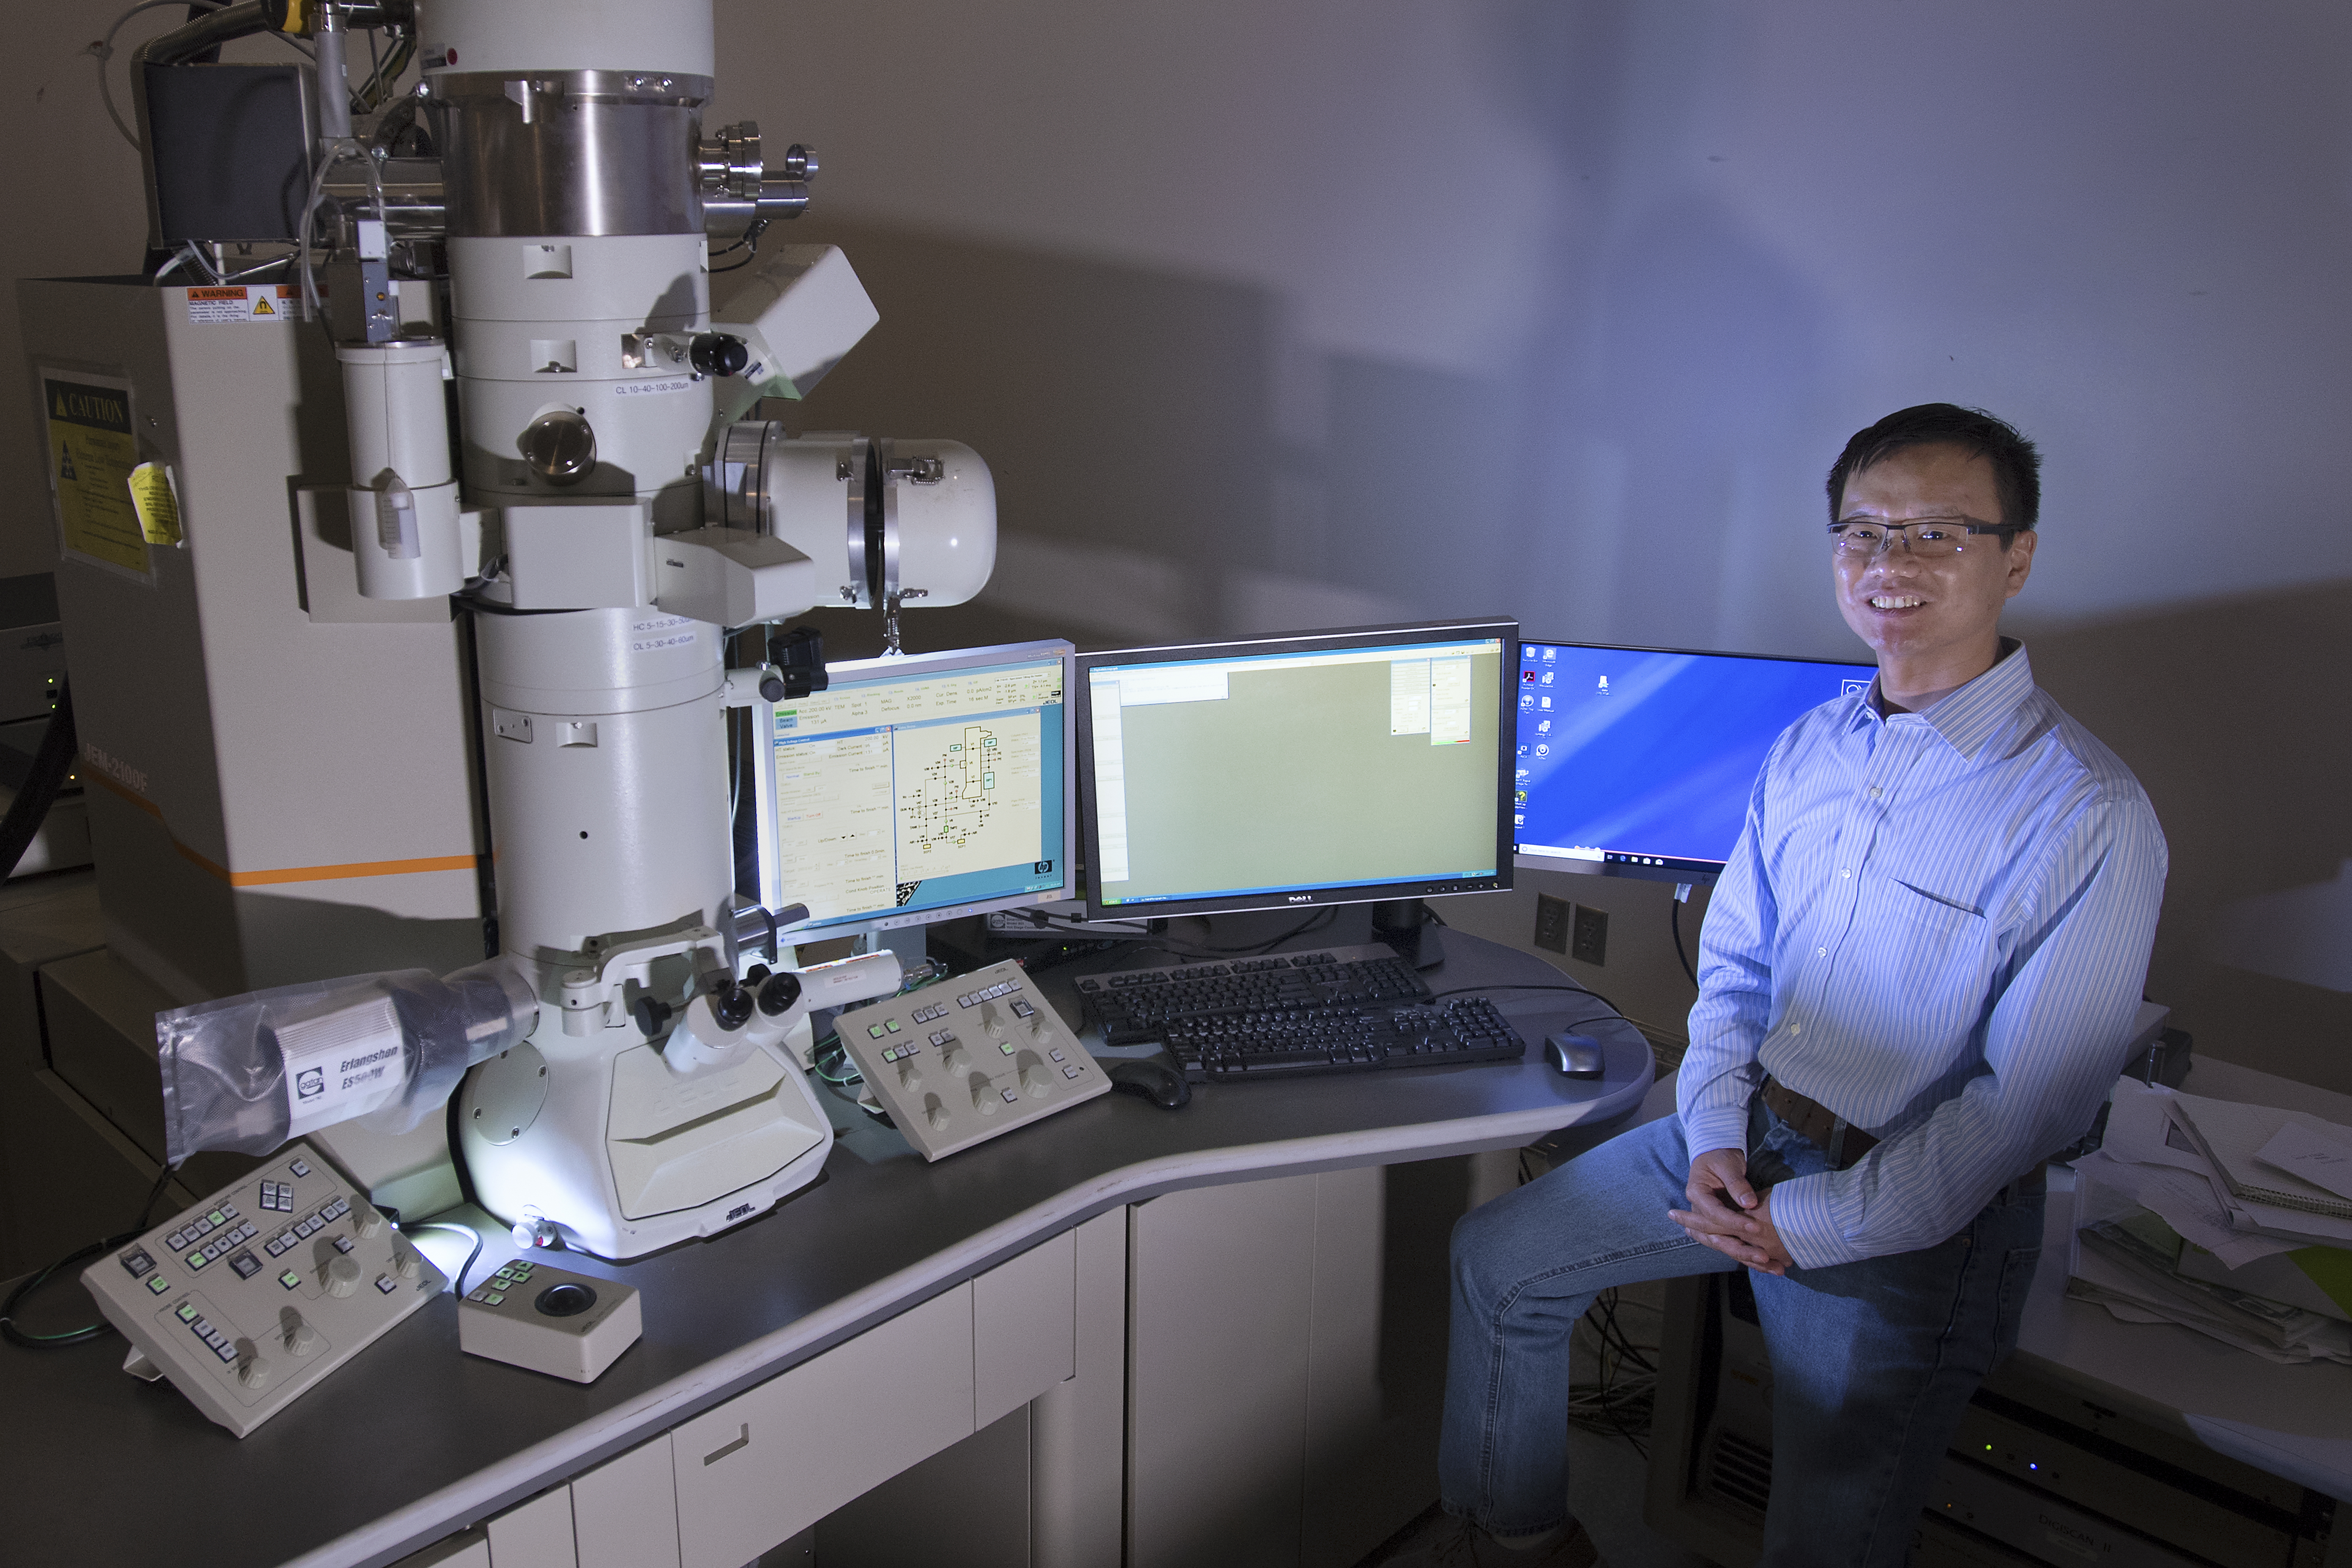
Xiaohui Qu is an assistant scientist in the Theory and Computation Group at the Center for Functional Nanomaterials, where he applies various approaches in artificial intelligence to analyze experimental and computational nanoscience data. Shown on his computer screen is an image segmentation result for gold nanoparticles recorded by a transmission electron microscope (left) and a profile showing the evolution of particle sizes for a coalescence event in which the nanoparticles aggregate (right).
A year ago, Xiaohui Qu joined the Center for Functional Nanomaterials (CFN)—a U.S. Department of Energy (DOE) Office of Science User Facility at Brookhaven National Laboratory—as an assistant scientist in the Theory and Computation Group. Previously, he was an assistant project scientist in the Department of Materials Science and Engineering at the University of California, Berkeley, where he performed computations to find promising battery electrolyte materials. Though Qu is a quantum chemist by training, he also has experience in developing and applying data analytics techniques to address important questions in materials science. At the CFN, he is leveraging emerging technologies in artificial intelligence (AI) to advance nanoscience discoveries. Qu holds a PhD and bachelor’s degree in environmental chemistry from Shandong University in China.
The CFN, like many of today’s scientific research institutions, has a big data challenge. How can modern data analytics techniques help tackle the growing size and complexity of data?
Computer science technologies such as machine learning (ML) can help process big data being generated by scientific instruments. For example, the CFN Electron Microscopy Facility has a suite of transmission electron microscopes (TEMs) that scientists use to resolve the structural, chemical, and electronic information of nanomaterials. One type of TEM, an environmental TEM (ETEM), can monitor nanoparticle growth in operando—that is, how the structure of the nanoparticles evolves under relevant working conditions, such as annealing (heating to relatively high temperatures) or exposure to certain gases. Understanding how nanoparticles transform is key to improving material properties and functionalities. The ETEM has high time resolution (millisecond scale) that allows us to make measurements capturing their evolution. However, there is a huge amount of data that would be impossible to manually analyze.
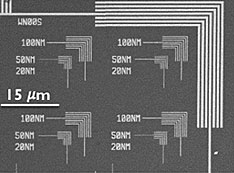
Consider that the ETEM generates two terabytes of data—equivalent to about 200,000 images—for the evolution of gold nanoparticles on silicon nitride surfaces, a potential catalyst system. Each frame contains hundreds of particles, whose size and shape need to be tracked over time. Automatic tracking is difficult because the images contain significant background noise. This noise appears as mixed points of white, grey, and black (instead of pure white or black), blurring out well-defined boundaries. This is where ML-based image recognition can help.
I am building several algorithms to detect nanoparticles, collaborating with CFN staff scientist Dmitri Zakharov, the point of contact for the ETEM; associate computational scientist Yuewei Lin of Brookhaven Lab’s Computational Science Initiative (CSI); and University of Pennsylvania professor Eric Stach, the former leader of the CFN Electron Microscopy Group. These image segmentation algorithms will identify the particles in single frames and link them from frame to frame to follow their evolution. Because missed or false detections in any frame will propagate through the particle evolution, the detection in each frame needs to be very robust. One of the algorithms we are developing tracks missed detections and corrects the resulting errors in evolution.
The evolution of gold nanoparticle catalysts is one experiment where automated image processing and analysis can help reduce the big data burden. Why did you select the gold nanoparticle data set, and how can your approach of image segmentation be extended to a broader range of materials of interest for catalysis and other applications?
The dataset already existed based on prior measurements by Dmitri and Eric, and it is representative of the type of data we need to study. Also, it is common ground for ongoing work with the Stach Group at UPenn, where they are doing similar image processing research on the same dataset but with a different technical approach. Using different image segmentation approaches—for example, edge-based object detection and watershed, in which images are regarded as topographical maps—we are jointly searching for the best algorithms to handle the significant noise present in nanoparticle images.
Looking forward to testing our approaches on new datasets, some of the specific image segmentation parameters (e.g., threshold values) will not be transferrable between different data sets, but we expect that the algorithms will be. Anticipating the need to tune these parameters for new datasets, I am also developing a graphical user interface (GUI) so that users can adapt the segmentation procedure depending on their specific data set and run the same code.
In this way, we are serving the user community, and we are obtaining labeled data for different datasets. Eventually, we will have a large number of labeled datasets containing sufficient variations to train a deep learning model. Deep learning is an advanced form of ML that will allow us to create a more general model that is applicable to different experiments, ideally without the need to adjust any parameters.
You mentioned the term GUI. Not only do you have to process the data; you also need to present those processed data to end users in a user-friendly way. Once you have built a data analytics tool, how do you go about making it available?
Yes, we and CFN users not only need a data analytics solution but also a framework to deliver that solution. When I first started at the CFN, I did not know what kind of web service we would need. It soon became clear that we needed a dynamic environment—one that would allow us to improve the data analytics tools in response to changing user requirements.
 enlarge
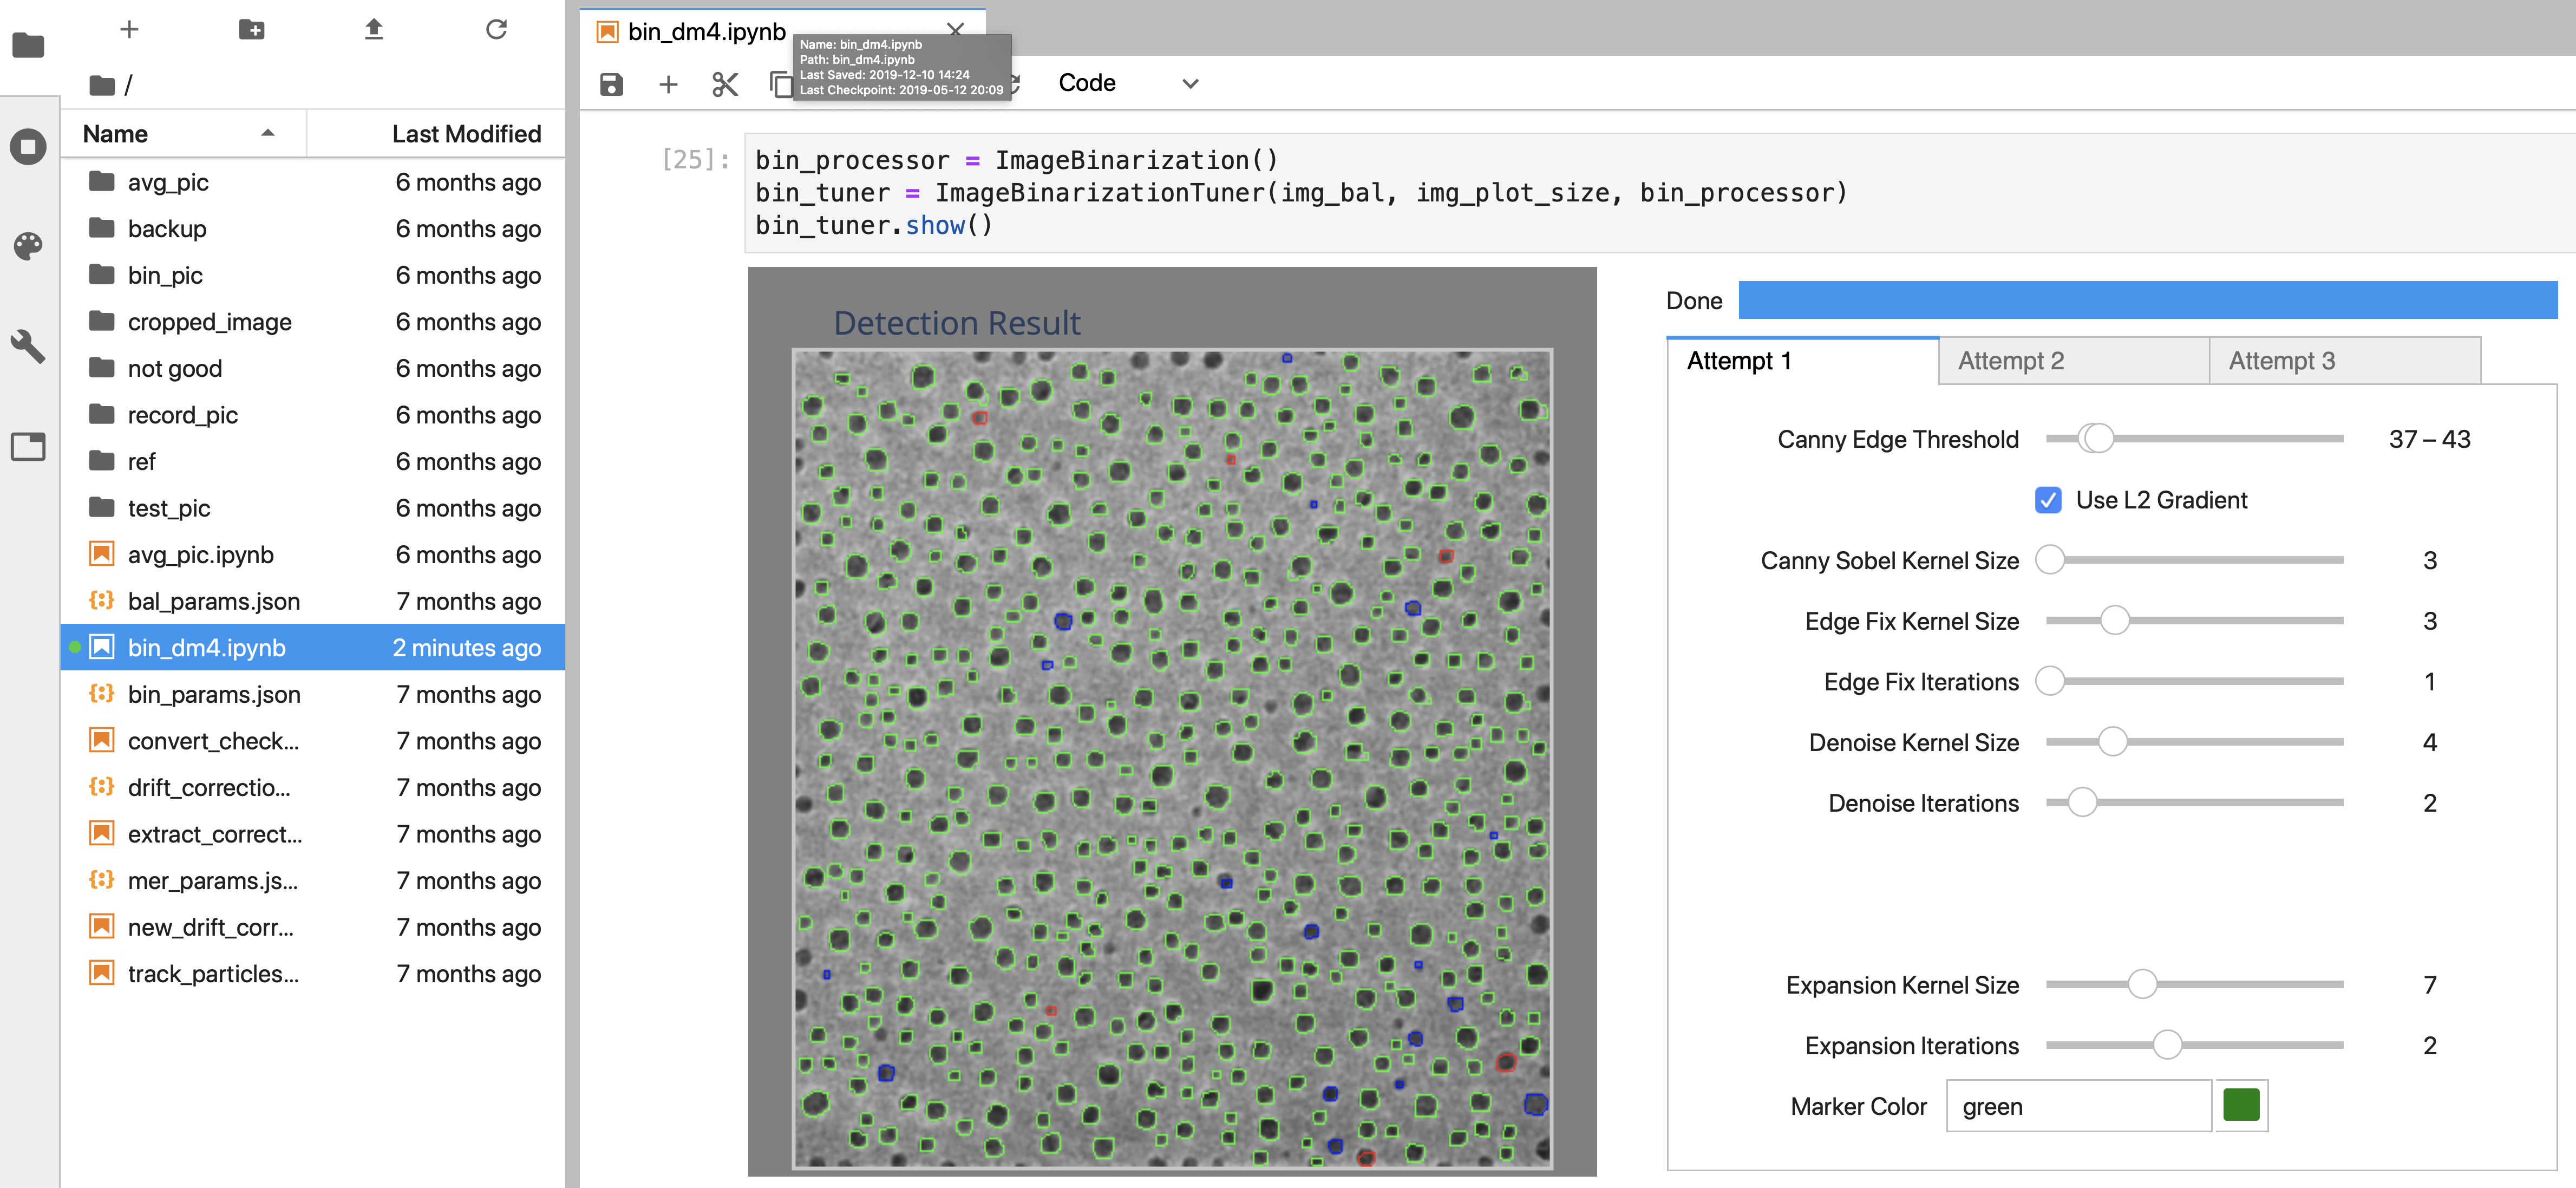
A screenshot of a Jupyter notebook showing the graphical user interface (GUI) to explore the parameters for segmenting nanoparticle images recorded by an ETEM. Users can combine the results of three different parameter sets (labeled as attempt 1, 2, and 3 in the tabs and respectively represented by the green, blue, and red circles in the detection result image). Dragging any of the slide bars generates a segmentation result immediately.
I ended up talking to computer scientists at Brookhaven’s Scientific Data and Computing Center (SDCC), part of CSI. In particular, SDCC technology architect Ofer Rind mentioned that a good option for delivering the data analytics tools and providing access to large data sets would be JupyterLab and JupyterHub. This web-based user interface supports a dynamic programming environment and interactive widgets, or GUI elements that users can control to visualize their data. I presented this concept to my group leader, Mark Hybertsen, who agreed. Image segmentation naturally has a big data visualization requirement, so Jupyter was the perfect choice. A computer server run by SDCC now hosts this service, and we are testing it for pilot projects.
The implementation of our image segmentation tool on JupyterLab showcases how a cloud platform can support users. Such platforms will be useful to other CFN groups and users for different tools. In fact, I am working with CFN staff scientist Esther Tsai to develop another tool to support x-ray scattering data analysis at the National Synchrotron Light Source II (NSLS-II) [another DOE Office of Science User Facility at Brookhaven], where CFN and NSLS-II have partner x-ray beamlines. Developers at the CFN are currently testing this tool, which will be released to CFN users once we confirm it is reliable.
Data analytics assumes you have data to work with in the first place. For many questions in science, some data are the results of experiments, like the TEM images you described, but other data are computational in nature. Do you also use AI approaches for computational data analysis?
Answering questions sometimes requires a combination of experimental and simulated data analysis. AI can be helpful in both cases. For example, a team of scientists from across Brookhaven Lab and Stony Brook University (SBU) has demonstrated a ML model that can infer local structure motifs in materials from simulated x-ray spectra and provide references to compare with experimental x-ray spectra in significant test cases. This ongoing research effort has involved a series of projects by CFN theorist Deyu Lu in our group in collaboration with Anatoly Frenkel, a joint appointee in Brookhaven Lab’s Chemistry Division and at SBU Chemistry; CSI computational scientists Shinjae Yoo and Yuwei Lin; NSLS-II Inner Shell Spectroscopy lead beamline scientist Eli Stavitski; and CFN Interface Science and Catalysis Group leader Dario Stacchiola.
I have recently joined this research effort, and we are expanding on the work in several ways. For example, we are collaborating with CFN staff scientist Mingzhao Liu of the Interface Science and Catalysis Group to develop a model that can infer the structure of thin films of silicide, a potentially useful catalyst or superconductor.
We are also working with Bruce Ravel, a physicist at the National Institute of Standards and Technology who is stationed at the NSLS-II Beamline for Materials Measurement, to build a database of experimental spectra for thin films. The database will contain high-quality experimental measurements for several representative materials. One of the current challenges in ML is that it requires a very large scale of data with high fidelity. With better computational capabilities, we can now create large databases of simulated spectra. However, the same cannot be said for experimental spectra; it is not only time consuming but also expensive to create a large-scale experimental database. We can reduce the amount of data required for ML by building a model on hybrid data sets containing both computational and experimental spectra. At the same time, by validating computational spectra with experimental spectra, we can attain high data quality.
What is the most challenging part of applying data analytics to materials science?
The definition of the problem itself is very challenging. Materials scientists know the questions they are trying to answer in materials science terms. But phrasing these questions into executable problems in data science requires the knowledge of both materials and computer science. It is an iterative process involving collaboration between experimentalists, computational chemists, and data scientists.
A good example of such refining relates to another project on superconducting thin films that I am beginning to work on. Initially, the scientists told me they wanted to understand film growth. I did not know what they were exactly referring to with the word “growth.” Through our discussions, I discovered that one of their key questions was how a single layer is built up. Armed with this knowledge, I can now develop the appropriate technique for resolving these monolayer dynamics.
Each of your projects is very collaborative, involving interactions with scientists from different disciplines. You were initially a chemist and then gravitated toward data science. How did this career trajectory evolve, and how do you think this unique background impacts your research?
I had an inherent interest in chemistry because many of the products we know and use as consumers are chemicals. But it was not until I went to university that I discovered I actually liked chemistry. At this time, I also started teaching myself computer science through online resources and library books, thinking a career in computer science may be more lucrative. But through this educational process, I came to the realization that computer science is critical to solving questions in materials science.
For my PhD, I applied computational chemistry to atmospheric pollution. Then I moved from China to Singapore, where I did a postdoc using computational biology tools to model protein folding. Afterward, I did another postdoc in Portugal, using ML to predict chemical reactivities in drug molecules. At Berkeley, my focus shifted to electrochemical energy storage systems. I calculated the properties of these systems with density functional theory (DFT) and helped build a large-scale database containing this property information for the battery electrolyte research community.
 enlarge
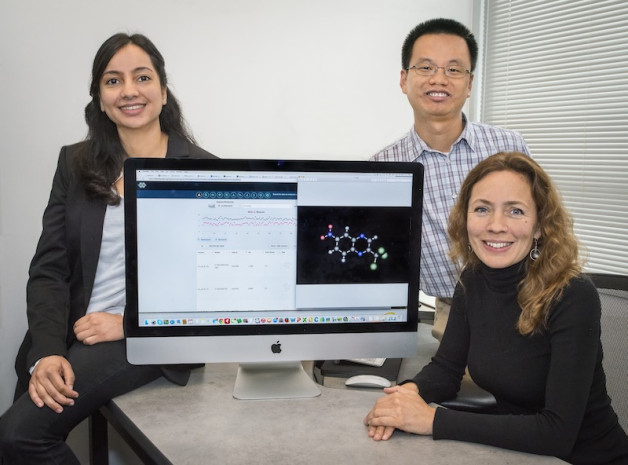
At Berkeley Lab, scientists Kristin Persson (right), Nav Nidhi Rajput (left), and Xiaohui Qu built the "Electrolyte Genome," a Google-like database of molecules for battery scientists. Credit: Roy Kaltschmidt/Berkeley Lab.
My dual background in computer science and materials science is extremely helpful. As I mentioned, materials scientists and computer scientists typically speak different “languages,” and thus they lack an understanding of what each is trying to achieve. If computer scientists can understand the requirements from a materials science point of view, then they can suggest feasible data analytics solutions. Through my research, I want to better bridge the two fields.
Because CFN is a national nanoscience user facility, its facilities are available for use by scientists from all around the world. As a result, the CFN community is made up of staff and users with not only specialized domain expertise but also different cultures. How did growing up in China, completing postdocs in Singapore and Portugal, and now living and working in the United States prepare you for this multicultural, interdisciplinary environment?
Traveling all over the world has exposed me to many cultures and disciplines. I can look at questions from different angles, get to know the experts in a particular area, and better understand their ideas. This ability is especially helpful at the CFN, where everyone uses unique techniques for materials discovery. People from different disciplines really do think differently. Even the same word can have different meanings depending on the field. For example, “microscale” means at the level of proteins for biologists, but for chemists it refers to several orders finer (atomic resolution). Understanding terminology in domain-specific contexts is important to understanding scientific problems and requirements.
AI is a buzzword nowadays, coming up in everything from stock trading and music streaming to navigation apps and surveillance systems. Much progress has been made, but AI is still in its infancy stage. How do you foresee AI transforming the scientific enterprise, in particular materials science, in the years to come?
Emerging data science technologies have the potential to dramatically change many fields. My hope is that the tools we develop are game changers for materials discovery, transforming data into a usable format from which knowledge can be extracted. Or, even further, I hope that our tools enable kinds of science that have not been possible before—for example, autonomous experiments. Automation would not only make parameters more consistent across experiments but also revolutionize how facilities are operated. Developing automated pipelines from experiments to analytics would allow users to focus on their science, without the need to manually interact with equipment or learn how to program. It is very hard to predict the timeline for these future technologies, but we are trying our best.
Brookhaven National Laboratory is supported by the Office of Science of the U.S. Department of Energy. The Office of Science is the single largest supporter of basic research in the physical sciences in the United States and is working to address some of the most pressing challenges of our time. For more information, please visit http://energy.gov/science.
Follow @BrookhavenLab on Twitter or find us on Facebook.
2020-17017 | INT/EXT | Newsroom