NSRL User Guide: Biology Experiments
II. Operations
Target Room Exposure Levels
Abstract
This note reports the results of measurements for the thermal neutron and charged particle flux at locations throughout the NSRL target room when running beams of protons and Iron ions (Fe). These results are descriptive, meaningful only at the level of ~20%, since the details of the radiation field depend on many things that are neither recorded nor under the control of the experimenters.
At a location near the target stand, 6 meters downstream of the Booster vacuum window and 1 meter perpendicular to the beam, the neutron flux is 1.6 x 10⁻⁷/cm2 per incoming nucleon for a beam energy of 1000 MeV/n. In terms of dose, this can be stated as 3.3 x 10⁵ neutrons per Gray of 1000 MeV protons, or 2.7 x 10⁴ neutrons per Gray of 1000 MeV/n Iron ions.
Typical charged particle flux at the same location is 3.9 x 10⁻⁷/cm2 per incoming proton at 1000 MeV. For iron the charged particle flux is 1.1 x 10⁻⁴/cm2 per incoming Fe ion at 1000 MeV/n. In terms of dose, this can be stated as 7.8 x 10⁵ charged particles per Gray of 1000 MeV protons, and 3.3 x 10⁵ charged particles per Gray of 1000 MeV/n Fe ions.
Beam
The heavy ion beams used in this study are primarily protons and iron at energies in the range 200 MeV per nucleon to 1000 MeV/n. Some additional data were taken with carbon, silicon, oxygen, and titanium. The beam was the large biology beam with a uniform illumination over an area of 400 cm2 (~20cm x 20cm), at beam intensities that ranged over three orders of magnitude. Some running conditions included running with a collimator, and shielding made from polyethylene and tungsten.
Delivering a dose of 1 Gray to tissue equivalent
(water) samples requires 3.2 x 10⁹ protons per square centimeter
at a kinetic energy of 1000 MeV.
If the beam is iron, 1 Gray is equivalent to 4.7 x 10⁶ Fe ions
per cm2 at 1000 MeV/n.
In calculations of dose, it will be assumed the beam is a “standard”
biology beam; i.e. 20cm x 20cm, or 400 cm2 with wings at higher
intensity than the central sample region.
So a beam that delivers 1 Gray of protons(Fe) corresponds to (3.2 x
109/cm2 *
400 cm2 * 1.6 wing factor) = 2 x 10¹² protons (3 x 10⁹
Fe ions or 1.68 x 10¹¹ nucleons) at 1000 MeV/n.
Detectors
The beam intensity was measured using the dosimetry ion chambers; specifically the IC-302 chamber. It produces a current that is proportional to the delivered dose, and is calibrated to report the total number of ions in the beam.
Thermal neutrons are measured with a Reuter-Stokes He-3 filled counter operating in Geiger mode. It has extremely high efficiency for detecting thermal neutrons, in the energy range below ~1 eV. It is a cylindrical tube, 1cm in diameter and 10cm long, presenting a cross sectional area of 10cm2 to the neutrons. It was operated at a voltage of 1300 volts.
Charged particles are detected with a plastic scintillator, 5cm x 5cm and 2mm thick, viewed by a 5cm PMT through a Lucite light guide matched in size to the scintillator. The PMT operated at 1800 volts, with signals being transported ~200 feet through RG-58 cable and then discriminated at the 50 mV level. This gave a singles rate of ~10 Hz in the absence of beam. Under these conditions it was highly efficient for singly charged tracks like protons of 1000 MeV, near minimum ionizing. It also counted photons with reduced efficiency, depending on the energy of the photon. It was possible to see activation gamma rays in this counter in the interval between spills when the singles rate in the PMT would rise significantly. No attempt was made to correct for high energy gammas by subtracting out these photons. Nor were any subtractions made to correct for electrons or other charged particles in the radiation field.
During measurements, the outputs of all three devices were counted on scalers and at the end of a measurement that lasted typically 1 minute, the scalers were recorded. The data is presented in Appendix 1. The rates are calculated from the ratio of the two scalers, Neutrons/Beam or Charged/Beam, after accounting for the size of the detectors. Parameterizations were used to calculate rates for beam energies or locations that were not measured. These parameterizations are given below.
Thermal Neutrons
Thermal neutrons behave like a gas, diffusing more or less uniformly throughout the room. They are produced when beam particles strike the beam dump, or anything else in the beam like a collimator. Most of the neutrons observed do not come from the beam particles themselves, but are liberated in the hadronic shower process in the dump. For this reason, the neutron flux in the target room is dependent on the total number of incoming nucleons in the beam. Also, increasing the energy per particle increases the number of neutrons produced in the shower.
The thermal neutron flux is measured to be 1.6 x 10⁻⁷/cm2 per incoming nucleon at 1000 MeV/n at a position out of the beam near the normal target location, z = 6 meters downstream from the vacuum window. If the beam is 1000 MeV/n Fe-56, then this can be translated into 2.7x 10⁴ neutrons/cm2 per Gray delivered. For a 1000 MeV proton beam, the corresponding thermal neutron flux would be 3.3 x 10⁵ neutrons/cm2 per Gray delivered. The conversion to Grays is a function of energy, and differs for each ion beam.
The spatial distribution of the neutron flux was measured. Figure 1 shows the relative neutron flux measured at a selection of locations throughout the NSRL Target Room. Figure 2 shows the variation with horizontal distance from the beam center. It is assumed that the distribution is symmetrical about the beam axis.
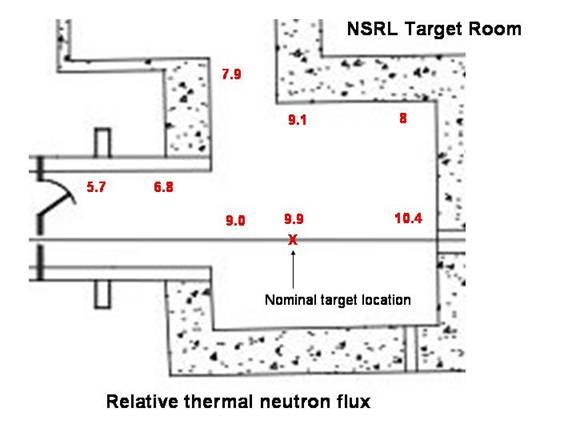
Figure 1 shows a schematic of the NSRL target room with indication of the location of the nominal target position and the relative thermal neutron flux at eight locations within the room.
Figure 2: Thermal neutrons measured as a function of
the distance in meters from beam center at a Z location of 6 meters (nominal
target location). The beam used
was Fe-56 at 1000 MeV/n, in a 20cm x 20cm spot running normal biology
targets. Beam intensity was
typically 8 x 10⁷ Fe ions per spill. The Z dependence along the beam line is shown in Figure
3. It is the proximity to the
beam dump where the neutrons are produced that is responsible for the
increase at the end of the beam line. Figure 3: Thermal neutrons measured as a function of
the distance in meters from the vacuum window at a location 1 meter from the
beam center. The beam used was
Fe-56 at 1000 MeV/n, in a 20cm x 20cm spot running normal biology targets.
Beam intensity was 8 x 10⁷ Fe ions per spill. Figure 4: Energy dependence of the thermal neutron
flux. The energy dependence was
measured with a silicon beam of energies 300, 600 and 850 MeV/n, and scaled
to the 1000 MeV/n Fe-56 rates.
When the neutron detector was placed behind 5 cm of
polyethylene shielding material, the neutron counting rate approximately
doubled, indicating that there is a significant fraction of the neutron
spectrum that is not thermalized, but is at higher energy.
Future studies could examine how much poly would be required before
the thermal neutron rate would decrease as the capture in the poly would
start to exceed the increase in thermal neutron production as the faster
neutrons are slowed down in the poly.
This represents the single largest uncertainty in the analysis so
far. Shielding the neutron detector with 5cm thick tungsten
blocks reduced the counting rate by ~20%. Additional studies were conducted with beam collimators
placed on the target stand. When
a combination Lucite/Aluminum/Polyethylene collimator was placed on the
target stand, the neutron counting rate approximately doubled over the rate
measured in the presence of biology samples.
Using a tungsten collimator instead of the laminate increased the
rate by a factor of 3.5 over the rate without a collimator.
The reason for this is that the thermal neutron rate scales not just
with the Atomic Weight of the beam particles, but of the target particles as
well. The beam dump is a
combination of steel and concrete, to compare with the tungsten collimator.
Taking the atomic weight of the target into account gives reasonably
good agreement when comparing thermal neutron production rates. We measured the thermal neutrons produced by beams of
various ions, from protons, Carbon, Silicon, and Iron. As expected,
the neutron production scales approximately with the number of nucleons
in the beam, Abeam, as shown in Figure 5.
The Abeam dependence assumes neutrons are produced in the
beam dump. If high-Z targets or collimators are inserted into the
beam, details of the beam and target can modify the simple Abeam
scaling to Abeam + Atarget. Figure 5 shows the Abeam dependence
of the neutron flux. The line is the result of a linear fit. In comparing charged particles to neutrons, the biggest
difference is that the charged particle rate falls steeply as you move away
from the beam axis. This
distribution was measured using 1000 MeV/n beams of both Fe-56 and protons.
There is no significant difference in the angular distribution of
charged tracks coming from the two different ion species at large angles
such as the regions reported on in this note (greater than approximately 20
degrees), although the small angle rates may be substantially different. Unlike thermal neutrons, the charged particle flux does
not scale with Atomic Weight.
The scaling for charged particles is closer to the square of the Atomic
Number, similar to the scaling of LET and energy loss.
The deviation from strict scaling with Z2 is probably
because the charged particles are produced by a variety of mechanisms, each
with different scaling. A comparison of the charged particle rates as a
function of distance from the beam center is shown in figure 6, with data
taken during 200 MeV proton beam running.
The value at a distance 2.3 meters from beam center is 5.3 x 10⁻⁹
per cm2 per incoming 200 MeV proton.
The fit is to a power law with exponent of -2.15.
At a distance of 0.9 meters from the beam, the charged particle flux
is 67.7 x 10⁻⁹ per cm2 per incoming 200 MeV proton,
rising to 170 x 10-9 per cm2 per incoming 200 MeV
proton at 0.5 meters. Figure 6: Charged particle flux as a function of the
distance from beam center in meters.
The flux is in units of charged particles per square cm per 109
incident 200 MeV protons. The
fit is a power law in R, the distance from beam center, using the power
-2.15. Figure 7: Charged particle rate per square cm per 108
incident protons as a function of the proton beam kinetic energy, in MeV.
These rates were measured at a location that was 0.9 meters away from
beam center transversely, and 1.9 meters downstream of the Booster vacuum
window. Figure 7 shows the energy dependence of the charged
particle rate. With only three
energies measured, 200, 500 and 1000 MeV, the rate fits well to a linear
function of beam kinetic energy.
The points in Figure 5 were measured at a location 0.9 meters from beam
center and 1.9 meters downstream from the Booster vacuum window.
There is very little variation in the charged particle flux as a
function of position along the beam. For different ion species, such as Iron, the charged
particle rate scales roughly like Z2.
This gives values for the charged particle flux at the location (0.9,
1.9) meters of 4.2 x 10⁻⁵ per cm2 per incoming 1000
MeV/nucleon Fe ion, and 2.2 x 10⁻⁵ per cm2 per
incoming 600 MeV/nucleon Fe ion.
Scaling with Z2 from the proton data yields a prediction of 4.7 x
10-5 at 1000 MeV to compare with the 4.2 x 10⁻⁵ for
Fe, giving reasonably good agreement. As for the neutrons, it is possible to recast these
results in terms of delivered dose (Gray) rather than beam flux, although
this conversion depends on assumptions about the beam size and shape.
Given a 20 x 20 cm2 beam spot with wings, the charged
particle rate measured at a location 6 meters downstream of the vacuum
window and 1 meter away from the beam center would be 3.9 x 10⁻⁷/cm2
per incoming proton at 1000 MeV.
Delivering one Gray with protons at 1000 MeV corresponds to 3.2 x 10⁹
protons/cm2. Using a
400 cm2 beam with a wing factor of 1.6 give 2 x 10¹²
protons in total. This produces
a radiation field of 7.8 x 10⁵ charged particles per Gray of 1000
MeV protons. The 1000 MeV/n Fe beam produces a charged particle flux
of 1.1 x 10⁻⁴/cm2 per incoming Fe ion.
At 1000 MeV/n, there are 4.7 x 10⁶ Fe ions per Gray.
Using the same beam assumptions from above, this converts to 3.3 x 10⁵
charged particles per Gray of 1000 MeV/n Fe ions. The purpose of this note has been to explain a series
of measurements taken to characterize the radiation levels in the NSRL
target room focusing on neutrons and charged particles.
The energy dependence was measured for both neutrons and charged
particles. The neutron and
charged particle rates were measured as a function of distance from the beam
(X) and distance along the beam (Z).
The neutron rate was observed to scale with the number of incident
nucleons (A) and to a lesser degree with the number of nucleons in the
target material or beam dump.
The charged particle rate scaled roughly with the square of the number of
incident protons (Z2)
This information should allow the reader to determine the strength of the
radiation field for any of the standard operating conditions to within about
20%. The data used to derive
these results are given in Appendix 1.
Charged Particles
Summary
Appendix 1
Ion Species and Energy
Charged particle rate (per cm2 per incident ion)
Neutron rate (per incident nucleon)
Detector Location (X.Z in meters)
Proton Energy Scan
200 MeV protons
4.5(1.5) x 10-8
2.5(0.6) x 10-8
0.9, 1.9
500 MeV
protons
8.7(2.9)
x 10-8
2.7(0.6)
x 10-8
0.9, 1.9
1000 MeV
protons
15.5(1.8)
x 10-8
7.7(2.7)
x 10-8
0.9, 1.9
Proton Transverse Scan
200 MeV
protons
15.4(3.0)
x 10-8
6.2(1.2)
x 10-8
0.5, 1.9
200 MeV
protons
9.8(2.0)
x 10-8
6.2(1.2)
x 10-8
0.6, 1.9
200 MeV
protons
8.0(1.6)
x 10-8
6.2(1.2)
x 10-8
0.7, 1.9
200 MeV
protons
7.1(1.4)
x 10-8
6.5(1.3)
x 10-8
0.8, 1.9
200 MeV
protons
6.3(1.3)
x 10-8
7.3(1.4)
x 10-8
0.9, 1.9
200 MeV
protons
5.3(1.1)
x 10-8
6.7(1.3)
x 10-8
1.0, 1.9
Silicon Energy Scan
300 MeV
Silicon
9.8 x 10⁻⁸
1.5, 1.5
600 MeV
Silicon
23.2 x 10⁻⁸
1.5, 1.5
850 MeV
Silicon
44.9 x 10⁻⁸
1.5, 1.5
Iron Energy Scan
600 MeV
Iron
22.3(4.0)
x 10-6
3.0(0.6)
x 10-8
0.9, 1.9
1000 MeV
Iron
42.4(4.0)
x 10-6
6.4(0.8)
x 10-8
0.9, 1.9
Iron Transverse Scan
1000 MeV
Iron
332(60) x
10-6
17.6(3.0)
x 10-8
0.5, 6.1
1000 MeV
Iron
96(19) x
10-6
16.5(3.0)
x 10-8
1.0, 6.1
1000 MeV
Iron
11.5(2.2)
x 10-6
14.6(3.0)
x 10-8
2.3, 6.1