NSRL User Guide: Biology Experiments
III. Technical Data
Bragg Curves and Peaks
Bragg Curves
Charged particles, such as protons and heavy ions, lose energy when passing through material primarily through ionization. The Bethe-Bloch equation describes that energy loss. The Bragg Curve is a graph of the energy loss rate, or Linear Energy Transfer (LET) as a function of the distance through a stopping medium. The energy loss is characterized primarily by the square of the nuclear charge, Z, and the inverse square of the projectile velocity, β. This gives the Bragg Curve its familiar shape, peaking at very low energies, just before the projectile stops. It is this Bragg Peak that makes ion therapy advantageous over X-ray treatment for cancer. The Bragg Curve falls with increasing energy until a minimum is reached near a velocity of β = 0.9, about 2.2 GeV for protons. LET increases slowly, rising logarithmically for energies above the minimum.
At the beginning of each day, the kinetic energy of the NSRL Beam is measured using the Bragg Peak. High density polyethylene (HDPE, ρ = 0.97 g/cm3) is used to slow down and stop the beam particles. An array of HDPE, called the binary filter, ranging in thickness from 16 cm down to 250 microns can be remotely inserted into the beam. The LET is measured with a pair of ion chambers, one upstream and one downstream of the binary filter. The plot of the ratio, downstream over upstream, shows how the relative LET changes as a function of the amount of material in the beam. A typical Bragg peak for 205 MeV Protons is shown below.
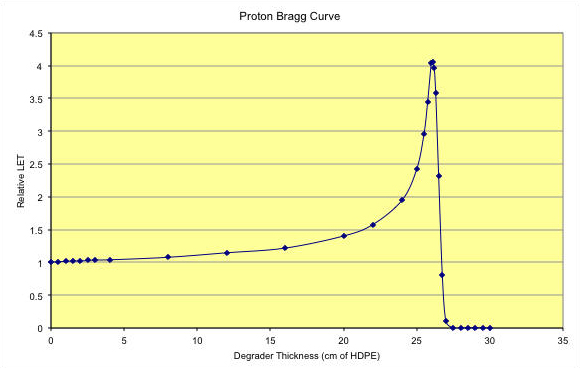
Figure 1: Bragg Curve for 205 MeV protons. Range in HDPE is 26.100 cm where the peak of the curve occurs. The LET at the entrance point is 0.4457 keV/micron in water.
A Bragg Curve for 290 MeV/n Carbon is shown below. For heavy ions, it is possible to break up the nucleus as it passes through the degrader. The nuclear fragments all have lower Z than the primary, so they will in general have a longer range. This produces a tail to the Bragg Curve that is not evident in the proton plot above.
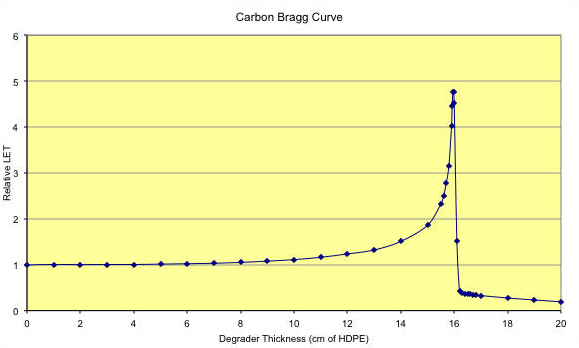
Figure 2: Bragg curve for 292.7 MeV/n Carbon ions. Range is 15.950 cm in HDPE. LET on entrance is 24.33 keV/micron in water. For degrader thicknesses beyond the Bragg Peak, 16 cm, you can see the tail produced by low-Z fragments.
When the primary ion of high-Z breaks up, it results in several low-Z fragments, each of which deposits small amounts of energy in the material. The sum total of all the energy deposited by all fragments can never add up to the energy deposited by the primary ion. This causes the Bragg Curve for fragmenting high-Z ions like Iron to drop initially. The interplay between increasing LET as the ion slows down, and decreasing LET as the ion fragments can work together to produce either a net loss or a net gain in total LET. In the figure below, for 1 GeV/n Iron ions, the losses from fragmentation exceed the gains from slowing down.
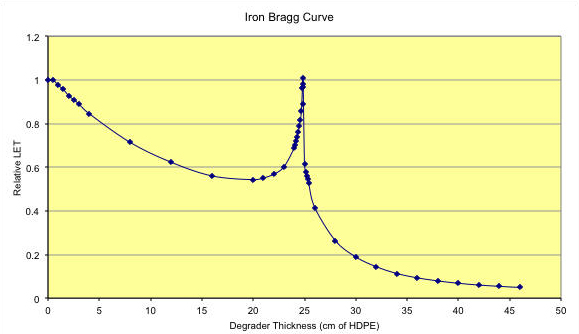
Figure 3: Bragg Curve for 962.8 MeV/n Iron ions. Range is 24.850 cm in HDPE, for an LET in water of 151.6 keV/micron. The initial drop in LET is due to the fragmentation of the Iron nuclei. The subsequent rise near 25 cm is due to the slowing down of the Iron ions. Note the substantial tail due to all the penetrating fragments out beyond the Bragg Peak.
For some low-LET beams, the amount of material required to stop the beam particles is too great and this measurement is not possible.
Of the several ways used to determine the kinetic energy of the beam and the associated LET, the most routine measurement is performed by measuring the Bragg peak. The relative LET is measured using the secondary ion chambers as greater and greater thicknesses of high density polyethylene are inserted into the path of the beam. When a critical thickness is reached, the beam particles will slow down enough in the polyethylene to stop in the ion chamber, giving a peak in the observed LET. From the location of the stopping peak, we derive the kinetic energy of the beam, and the LET that a beam of that kinetic energy would deposit in either water (for biology users) or silicon (for SEE users).
Bragg Peak Measurements at NSRL
We have accumulated Bragg Peak measurements for the following Ion species Click on the name to link to an EXCEL spreadsheet containing the data on range, energy loss, LET and spectra.
- Hydrogen (55, 103, 205 and 250 MeV)
- Helium (250 MeV/n)
- Carbon (200, 293 MeV/n)
- Oxygen (284, 600 MeV/n)
- Silicon (208, 305, 381, 403, 598, 834, 977 MeV/n)
- Chlorine (501, 531 MeV/n)
- Titanium (978 MeV/n)
- Iron (89, 114, 151, 263, 306, 585, 598, 963 MeV/n)
- Krypton (261 MeV/n)
- Xenon (273 MeV/n)
- Gold (160 MeV/n)